Published on: 2024-01-19
Updated on: 2024-01-19
The saying that speculation depends on technology is not believed by everyone. But even traders who are keen on analyzing fundamentals do not ignore the K-line and its basic patterns. One of the most important reference indicators is the doji, a small pattern that contains a wealth of information, and if you don't understand it, you'll suffer a big loss. In the following article, we will analyze the doji, a common K-line Pattern, in detail.
 What does Doji mean?
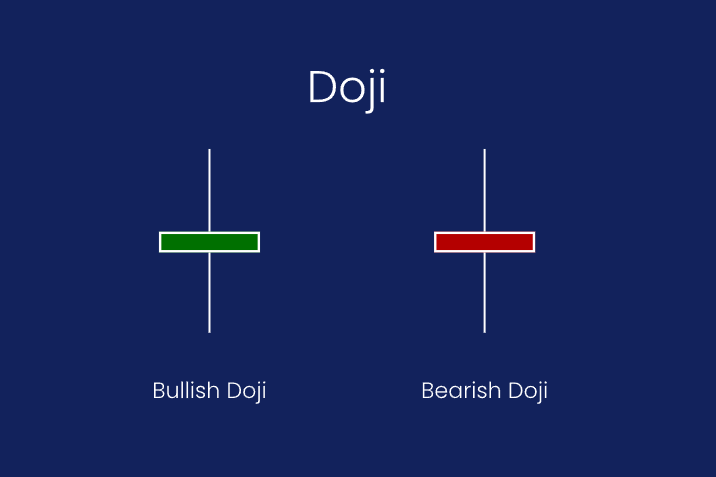
It is a candlestick pattern that takes the shape of a cross. It consists of upper and lower shadows with no solid parts. Appearing when there is no clear direction in the market for the time being and when the forces between buyers and sellers are tense, this pattern may signal a possible shift in the market.
Specifically, it is characterized by a small, solid body and relatively long upper and lower shadows. The small size means that the price difference between the opening and closing prices is very small, and sometimes they are even equal. The upper shadow is formed by the difference between the high and the close, while the lower shadow is related to the open and the low. Relatively long upper and lower shadows indicate that a large price movement occurred during the day, but eventually the closing price returned to a level close to the opening price.
Because the opening and closing prices are so close, it creates a candlestick chart with almost no solidity. Also, because it has upper and lower shadows extending out, it will form a crossover pattern. It may also be completely absent, but it will also take the shape of a cross. This cross pattern occurs when the market does not have a clear direction for the time being and when buyers and sellers feel a tension of power.
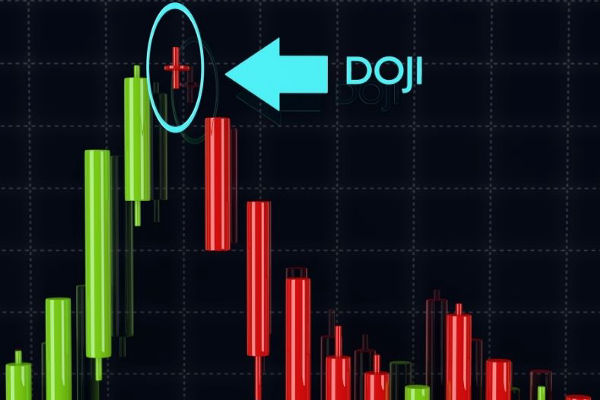
It also serves an important purpose and can help catch some turnarounds at certain times. That means when it appears at the top or bottom of an uptrend or downtrend, it represents an opportunity for a trend shift.
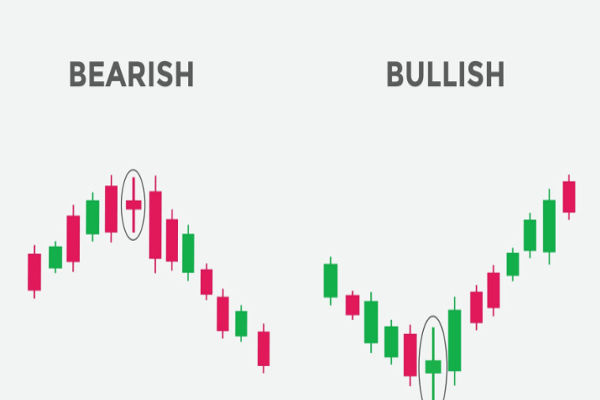
For example, when it is in an uptrend, if there has been a positive candle all the way to the top, a cross appears. This means that the buying power has started to decrease and the selling power has increased, hence the cross, which usually indicates a possible trend reversal. Or if a negative candle appears at the top instead of a doji, it may signal a turnaround.
On the other hand, if it is in a downtrend, it can also signal a trend reversal. When a doji appears at the bottom of a negative candle, This is an indication that the sellers may be weakening and starting to see a bottom, which is beginning to be supported. A positive candle in this position could also signal a trend change.
The doji is an important pattern that shows market uncertainty and potential trend changes, but it is important to note that there is a limit to analyzing a single k-line pattern. So in practice, it is recommended to combine it with the overall trend to form a more comprehensive judgment.
| Characteristics | Significance |
| Shape | Cross shape, shorter entity, opening and closing prices are close to each other |
| Market Uncertainty | Reflects the balance of power between buyers and sellers, market wait and see |
| Potential Significance | May signal a trend reversal or the beginning of intense volatility |
| Appearance Location | Usually occurs near trend turning points, support or resistance levels. |
| Confirmation Signal | Should be combined with other indicators and trend confirmation to prevent misjudgment |
It has numerous patterns, the most common of which are four. One is the Standard Cross, one is the Long Cross, and there is the Tombstone Cross and the Dragonfly Cross. A standard cross is a cross that is formed when the entity is short and the upper and lower shadows are long compared to the entity, indicating that the price experienced volatility during the trading day. It implies that there is uncertainty in the market, that buyers and sellers are equally matched, and that there is no clear trend.
Long crosses have long upper and lower shadows that form a cross shape, indicating that the price has experienced considerable volatility during the trading period. It can occur in an uptrend or downtrend and indicates that there is uncertainty in the market. It implies that there is uncertainty and a trading balance in the market with equal buying and selling power. It can signal a trend reversal, especially if it appears in a clear uptrend or downtrend.
It does not by itself provide a clear direction for the trend, although it reflects intense contention in the market. It does, however, indicate the beginning of a period of consolidation during which prices may trend. The appearance of a long cross indicates that sentiment is changing and that a trend reversal is about to begin.
The Tombstone Cross is usually seen in an uptrend in a stock or market and is a reversal signal in a short-term uptrend. It has a small entity with a long upper shadow and a short or non-existent lower shadow, forming a shape similar to a tombstone. Appearing in an uptrend may suggest that buyers' power is weakening and sellers may begin to dominate, with a possible price reversal.
It is a potentially bearish signal, indicating that sellers had the upper hand during the trading period, even though the price ended up closing at a similar price to the opening price. It suggests a change in market sentiment that could usher in a downtrend.
The Dragonfly Cross can appear in an uptrend or downtrend with only a lower shadow. The lower shadow is also very long, forming a shape that resembles that of a dragonfly. It may indicate a short-term equilibrium in the market and is a potential reversal signal, especially in a downtrend.
It is a bearish signal, reflecting the fact that there were buyers who pushed the stock price up on the day. But then there is pullback pressure, and it goes back to the low price. The longer the lower shadow, the stronger the bearish signal. Similarly, if it appears at the top of an uptrend, it indicates that the seller's power is weakening and the market may be bottoming out. The appearance of a dragonfly cross may be accompanied by a positive candle, signaling a possible market turnaround.

It is a candle in the shape of a doji where the market ends a particular day at almost the same price as the opening price. It usually indicates that there is uncertainty in the market and that the buying and selling forces are equal. The subsequent day's movement may be influenced by a number of factors, and it is not possible to simply rely on a single pattern to predict future market movements.
Some investors pay attention to the next price movement, especially to see if there is a price change that matches the direction of the cross. Generally speaking, the next day's move is nothing more than four scenarios.
The first is a continuation of the trend, which means that even though there was a closing cross, But the subsequent market still continues to develop in the direction of the original trend, indicating that the cross did not trigger a clear trend reversal.
The second is a trend reversal, which means that the trading day after the signs of price changes in the opposite direction may suggest a reversal of the market trend. For example, if a cross appears in an uptrend and the day afterward there are signs of falling prices, it could suggest the start of a downtrend.
And if there is an upward, solid candle, it may suggest increased buyer power. Although it suggests that a trend reversal is more likely, investors still need to watch for more reversal signals to confirm a change in trend.
It may also indicate a wait-and-see sentiment in the market, so the next day's action may continue to remain sideways or adjusted. Prices are moving in a relatively narrow range, reflecting the market's wait-and-see posture. The next day's action may continue to fluctuate within a range with no clear trend direction. Investors may choose to wait and see for a clearer trend signal.
The market may also continue to show uncertainty, with no clear trend direction. The next day's action may be influenced by investor uncertainty about market movements, leading to some price volatility. This may cause traders to wait and see for more signals.
It is important to note that patterns alone do not provide a complete picture of the market, and market movements are influenced by a number of factors. Investors often combine other patterns, indicators, and trend analysis to develop a more comprehensive trading strategy.
 How does the Doji work?
It usually appears when there is uncertainty in the market and may signal a trend reversal. If it appears in an uptrend and signals a price decline later in the market, it may suggest a possible trend reversal, and investors should carefully consider adjusting their positions.
It usually appears after a major drop, indicating that both the bulls and the shorts are battling fiercely within a certain range but ultimately not forming a clear winner or loser result. It can also be seen as a sign of resistance, suggesting that a reversal to the upside may be in the offing. That's why traders generally look for it in a major downtrend, paying particular attention to doji stars formed at low levels.
Of course, its appearance only indicates that resistance has occurred, and the decline is expected to reverse. That's all. It does not indicate an inevitable reversal; this must be clear. Therefore, it is necessary to wait for the subsequent price dynamics to confirm the trend reversal. If the subsequent price action matches the pattern of the cross, it may increase the reliability of the trend reversal.
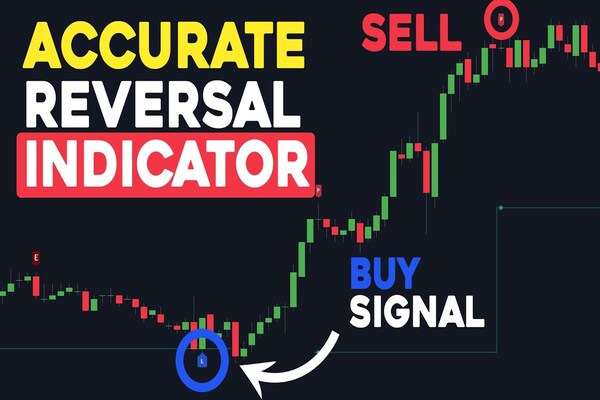
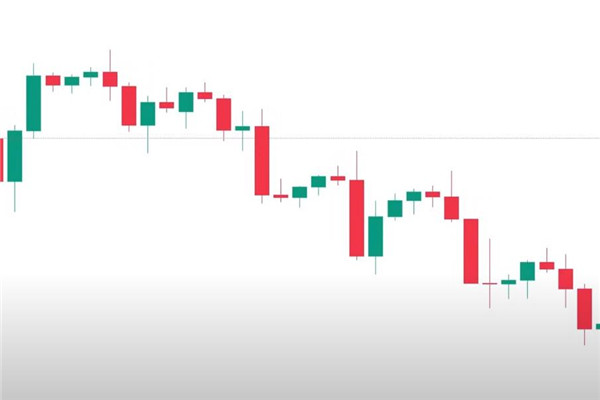
It is possible to wait for confirmation on the second trading day after its appearance. When the stock price strengthens the next day while rising to exceed the cross's value, it can constitute a buy point. One can also choose to take action after two crosses, which usually signals a stronger breakout. As seen on the BTC/USD chart above, the blue line represents the entry point, the red line above represents the stop loss level, and the red line below is the support level, which represents the target price.
At the same time, the pattern itself only shows that the bulls and the shorts are playing a game, but the market forces are quite without a clear winner or loser result. Investors may choose to wait and see for more information and signals. This helps to avoid making position adjustments when market uncertainty is high.
Because this signal strength is not very high, its trust is relatively weak, so in practice, it is important to emphasize the setting of the stop-loss level because its success rate is low. Generally speaking, its buy point is also the stop-loss point. If an investor has held a position prior to a trend reversal, the appearance of a cross may be a time to reassess risk and profitability goals.
For speculators or Day traders, the appearance of a cross may be a sign of caution and does not guarantee that a trend reversal will occur in the market. A cross formed at a high level may signal a correction, while a cross formed at a low level shows market hesitation. Observing the next day's market conditions in conjunction with other indicators such as averages, volume, MACD, and kdj can help to more accurately determine future movements.
| Trading Strategies | Description |
| Confirmation Cross | Small entities with relatively long upper and lower shadows. |
| Buy Signals | After the doji appears, observe the subsequent price dynamics |
| Trend Confirmation | A solid follow-up candle with upward movement may signal a buy. |
| Cautious | When buying, watch the overall market trend, consider other indicators. |
Disclaimer: This material is for general information purposes only and is not intended as (and should not be considered to be) financial, investment, or other advice on which reliance should be placed. No opinion given in the material constitutes a recommendation by EBC or the author that any particular investment, security, transaction, or investment strategy is suitable for any specific person.


World's Best Broker