The Holy Grail setup is a trend-pullback method, not a shortcut to finding winning trades. Its classic form waits for a 14-period ADX above 30 and rising, then for price to retrace towards a 20-period exponential moving average before the original trend shows signs of resuming.
Linda Bradford Raschke and Laurence Connors named it in Street Smarts, and the joke was deliberate. The appeal is one idea: do not chase a strong trend, wait for it to come back to you. The limitation is that a high ADX reading describes strength already recorded, not whether the next leg will continue.

The Holy Grail trading setup looks for pullbacks inside trends that are already established, not for new trends.
The classic version uses a 14-period ADX above 30 and rising with a 20-period EMA.
Reaching the EMA is not an entry. Price must show the original trend returning.
ADX measures trend strength, not direction, so a high reading fits an uptrend or a downtrend.
A textbook setup can still fail, because past momentum does not guarantee another leg.
The sequence is momentum, then pullback, then resumption. Each component has one job.
| Component | Function |
|---|---|
| ADX (14) | Identifies a strongly trending market |
| 20-period EMA | Provides the reference area for the retracement |
| Previous bar high or low | Tests whether price is moving with the trend again |
ADX does not decide whether the trade is bullish or bearish, because ADX measures directional strength rather than direction itself. A reading of 36 fits a powerful rally and a powerful decline equally well, so price structure determines the side.
Later adaptations often swap the exponential average for a simple one or lower the threshold. This article uses the original rules.
A strong trend must exist first. The 14-period ADX is above 30 and rising. The method makes no attempt to catch the first stage of a move.
Price pulls back towards the 20 EMA. In an uptrend it retreats, in a downtrend it rallies. The original logic emphasises the first pullback after strong momentum. A later setup requires ADX to turn higher above 30 again.
Price must attempt to resume the trend. For a long, a buy stop goes above the previous bar’s high once price has touched the average. For a short, the logic reverses below the previous bar’s low.
The new swing defines invalidation. A long position references the pullback low that has just formed, a short position the pullback high.
The figures below are hypothetical. Price climbs from 100 to 105, then 110, then 116. Over the same stretch ADX moves from 24 to 28, then 32, then 36. The market has already travelled a long way. Buying at 116 would mean entering after a substantial extension, before the pullback setup has formed.
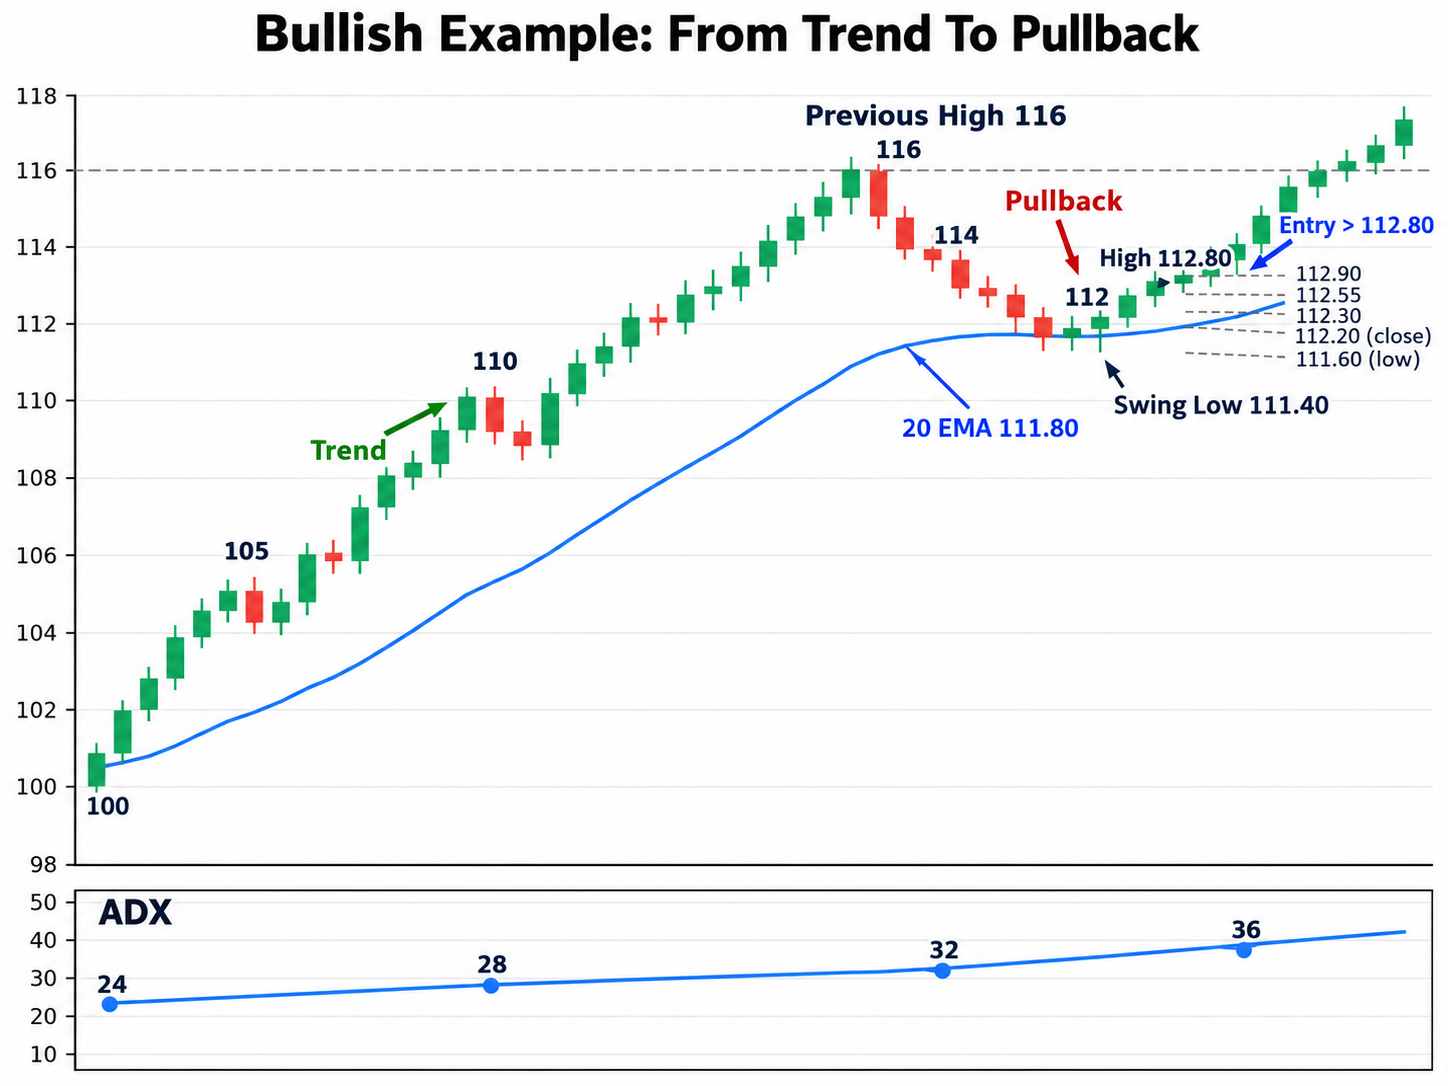
Price then cools from 116 to 114 to 112. The 20 EMA is now at 111.80. The next bar falls to 111.60, trades briefly through the average, and closes near 112.20. That bar’s high is 112.80.
The setup does not buy at 111.60. The trigger is a move above 112.80. If the following bar trades 112.30, then 112.55, then 112.90, price has exceeded the prior high and the entry is live. The newly formed swing low at 111.40 becomes the structural reference below. The previous high at 116 is the first place the continuation gets tested.
The mirror image follows the same order. Price falls from 82 to 77, then 72, then 67, with ADX rising to 34. Rather than selling into 67, the setup waits.
Price rebounds to 68.20, then 69.10, with the 20 EMA near 69.20. It reaches 69.25, fails to hold, and that bar’s low is 68.50. A break below 68.50 is the evidence that the downtrend is attempting to resume, with the rebound high as the reference above and the earlier low at 67 as the first test.
Suppose ADX runs 27, 31, 36, 39 as the trend develops, then eases to 37 and 34 as price retraces. Many traders read the decline as a warning.
That does not necessarily mean the trend is breaking down. ADX measures the strength of directional movement, so when price stops accelerating and begins consolidating, the reading can fall even while the larger structure remains intact. The original description of the setup expects exactly this, noting that the retracement is normally accompanied by a turn lower in ADX.
A falling ADX can describe a market losing momentum without proving that it has changed direction.
Consider a cleaner sequence. Price rises from 50 to 54, then 58, then 63, and ADX reaches 43. Price retraces towards a 20 EMA near 59, and a bar forms with a low of 58.70 and a high of 60.20. The next session trades to 60.30.
Every condition is present. The trend is strong, ADX is above 30, price has returned to the average, and the prior bar’s high has been taken out.
Price advances to 60.80. Then sellers return. It falls back through 59, breaks 58.70, and the bullish structure is gone.
Nothing, in the sense that the indicator did its job. An ADX of 43 confirms that the preceding movement was strong. It says nothing about whether enough demand remains for another leg.
The trend may have been mature. The retracement may have developed into a broader reversal rather than a temporary pullback, or a catalyst may have changed what participants were willing to pay. The setup describes a condition, not an outcome.
Compare two paths. The first runs 100, 105, 110, 114, then 112, then 115, a directional advance interrupted by one contained retracement. The second runs 100, 114, 107, 113, 105, 111, large two-way swings that can keep ADX elevated while the market becomes less orderly.
A high reading therefore says nothing about how clean the structure underneath is. Indicator compliance and trend quality are not the same thing.
The Holy Grail describes an entry framework. It does not, by itself, determine how much capital to risk, how position size should be calculated, how costs affect results, or which market and timeframe suit the method.
The published treatment does cover the protective stop, trailing, profit near the prior extreme and re-entry, but two traders can identify the same setup and finish with very different results.
Fix the definitions before looking at any historical results.
| Variable | Classic starting point |
|---|---|
| ADX period | 14 |
| ADX condition | Above 30 and rising |
| Pullback reference | 20-period EMA |
| Long trigger | Above previous bar’s high |
| Short trigger | Below previous bar’s low |
| Initial stop | Pullback swing point |
Change the threshold from 30 to 25, the exponential average to a simple one, or the trigger to an automatic entry at the average, and the results belong to a different method rather than to the original.
Stripped back, the logic is: find strength, wait for weakness, require strength to return. There is nothing mystical in it.
Its real contribution is behavioural. It stops a trader buying after an extended rise purely because the trend looks powerful, and demands patience and evidence instead. Neither a moving average nor a strength reading can determine whether a retracement will remain a retracement.
Sometimes it develops into a reversal. That is why Holy Grail works better as a memorable name for a pullback framework than as a description of what it can deliver.
Linda Bradford Raschke and Laurence Connors popularised it in Street Smarts in 1995. The name was tongue in cheek, chosen for the rules’ simplicity rather than any claim about reliability.
A 14-period ADX that is above 30 and rising. Adaptations sometimes lower the threshold, but a lower reading admits weaker trends and changes what the setup selects.
The original rules specify a 20-period exponential moving average. Several later interpretations use a simple moving average, which is why both appear in descriptions of the same strategy.
No. ADX measures trend strength rather than direction, so a high reading accompanies strong declines as readily as strong rallies. Price structure determines whether the setup is long or short.