Gold and silver remain two of the most closely watched assets in global markets — not only for their historical significance, but for what they reveal about today's economic climate. From inflationary pressures and interest rate changes to geopolitical tensions and shifts in trader sentiment, the spot prices of these metals offer real-time insight into broader financial trends.
As of 2025. gold is trading near historic highs, while silver continues to attract both industrial and speculative interest. Understanding how these prices move — and what shapes them over time — is essential for anyone following the markets or considering exposure to precious metals. By tracking daily fluctuations, analysing long-term performance, and examining key indicators such as the gold–silver ratio, traders can make more informed decisions in a volatile environment.
Today's Gold & Silver Spot Price – Live Charts & Updates
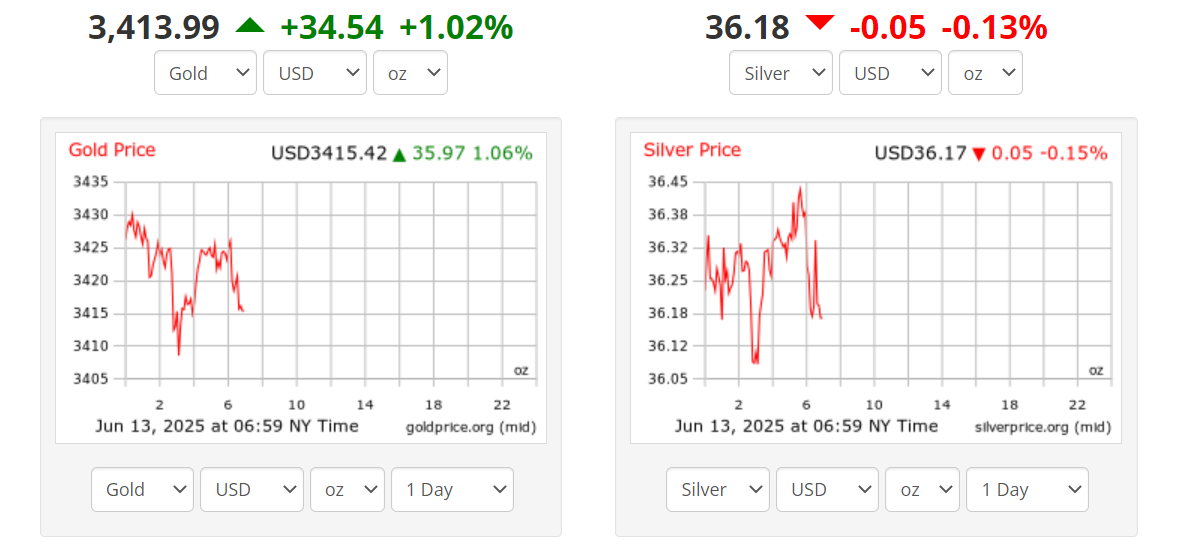 Gold and silver prices are showing moderate gains in today's trading session, reflecting ongoing market volatility and macroeconomic influences. As of the latest update, the spot price of gold stands at $3413.99 per ounce, marking an increase of 1.02% (+$34.54) over the past 24 hours.
Meanwhile, silver continues its upward momentum, currently priced at $36.18 per ounce, a 0.13% down (-$0.05) from the previous close.
Live pricing charts provide minute-by-minute updates. These tools are invaluable for short-term traders and long-term traders alike, offering a dynamic view of market conditions.
Historical Gold & Silver Prices – 10-Year Trends & Analysis
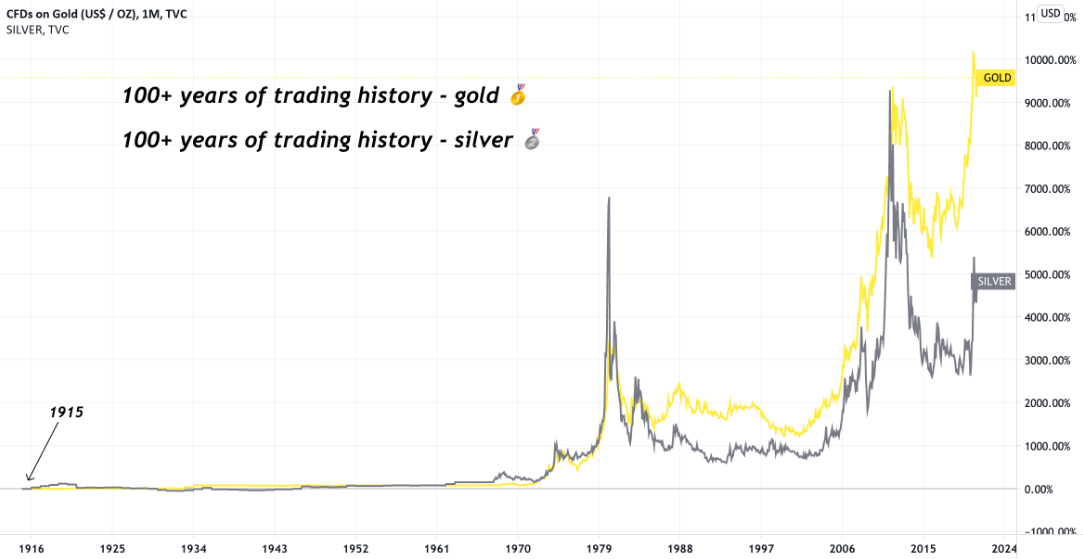
Looking at the past decade, gold and silver have followed distinct yet often parallel trajectories. Since 2015. gold has risen from around US$1.100 per ounce to above US$2.300. marking more than a 100% increase. The metal experienced major rallies in:
2016. following Brexit uncertainty
2020. during the early pandemic shock and interest rate cuts
2022–2023. as inflation surged globally and central banks shifted strategies
Silver, historically more volatile, has moved from approximately US$14 per ounce in 2015 to around US$30 in 2025. Key drivers of silver's growth have included:
Renewed industrial demand, especially for solar panels and electronics
Investment inflows during inflationary periods
Supply constraints due to mine shutdowns and regulatory changes
Despite its lower price, silver often outpaces gold during bull markets due to its dual role as a precious and industrial metal.
What Drives Gold and Silver Spot Prices? Key Factors Explained
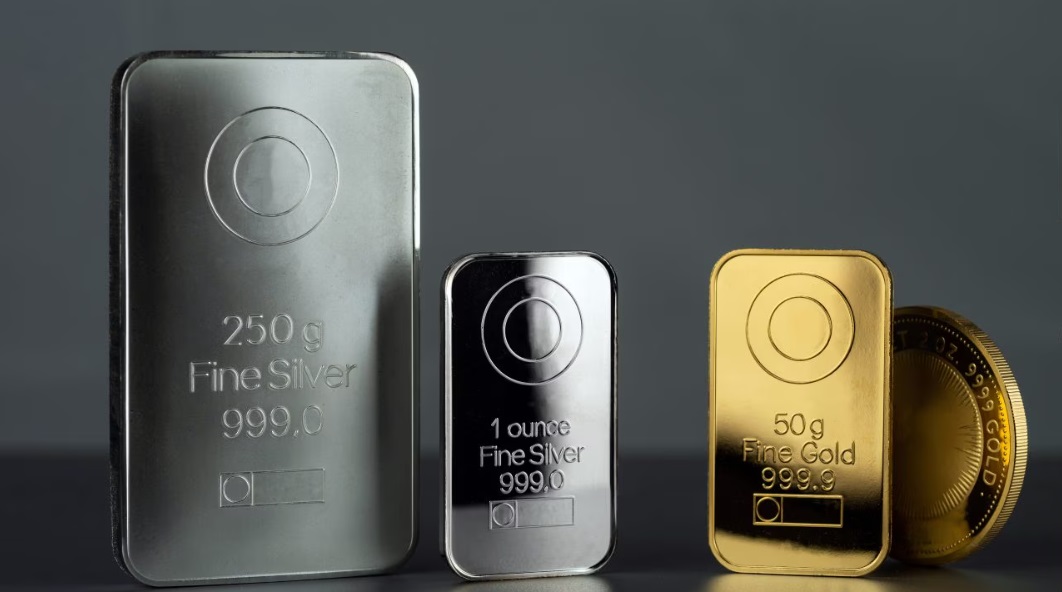
Several intertwined forces shape the spot price of gold and silver:
1. Inflation and Interest Rates
Precious metals are widely seen as hedges against inflation. When central banks raise interest rates to combat inflation, it can initially suppress gold and silver, as higher yields on bonds become more attractive. However, persistent inflation often rekindles demand for hard assets.
2. US Dollar Strength
Both metals are priced in US dollars globally. A stronger dollar tends to make them more expensive for foreign traders, putting downward pressure on prices. Conversely, a weakening dollar often coincides with gold and silver rallies.
3. Geopolitical Events
Periods of geopolitical instability—such as wars, political crises, or major sanctions—tend to boost demand for safe-haven assets like gold.
4. Industrial Demand
Silver is heavily used in manufacturing, electronics, solar energy, and medicine. Industrial cycles can significantly impact silver's spot price, unlike gold, which is driven more by investment flows and central bank holdings.
5. Supply-Side Constraints
Mining output, exploration budgets, and regulatory pressures can restrict supply and drive prices higher—especially if demand remains stable or increases.
Gold vs. Silver Price Ratio – What Does It Indicate?
The gold-to-silver ratio refers to the number of ounces of silver needed to purchase one ounce of gold. Historically, this ratio has averaged around 60:1. though it has varied widely depending on market conditions.
In 2020. the ratio spiked above 120:1 during early pandemic panic, suggesting silver was undervalued.
In early 2025. the ratio stands near 76:1. implying a slight preference for gold but not at extreme levels.
Many traders watch this ratio as a trading signal:
Long-term traders sometimes use the ratio to rebalance their holdings or to spot value opportunities.
Best Time to Buy Gold & Silver Based on Historical Data
While no one can time the market perfectly, certain patterns emerge when reviewing historical data:
Gold:
Often sees seasonal strength between January and May, partly due to demand from India and China during festive periods.
Typically rallies during periods of economic uncertainty and low real interest rates.
Silver:
Performs strongly when industrial activity rises or commodity cycles begin to turn.
Volatility makes it attractive for short-term traders, but patience is often required for long-term gains.
Notably, both metals tend to gain in value when:
Central banks shift towards dovish policy
Inflation expectations rise
Currency debasement becomes a concern
For long-term traders, dollar-cost averaging—buying at regular intervals regardless of price—remains a practical strategy to mitigate timing risk.
Final Thoughts
Gold and silver spot prices are influenced by a mix of global economics, trader psychology, and real-world supply-demand dynamics. By understanding today's prices, reviewing historical trends, and paying attention to key drivers, traders can make more informed decisions. Whether you're a seasoned trader or just beginning to explore precious metals, recognising the signals in the data can give you a sharper edge in uncertain markets.
Disclaimer: This material is for general information purposes only and is not intended as (and should not be considered to be) financial, investment or other advice on which reliance should be placed. No opinion given in the material constitutes a recommendation by EBC or the author that any particular investment, security, transaction or investment strategy is suitable for any specific person.
