Published on: 2025-06-16
Updated on: 2025-06-16
Bullish and bearish flag patterns are among the most reliable continuation signals in technical analysis. Recognising and trading these patterns can help traders capture strong moves in trending markets and manage risk more effectively. Here are five essential tips for identifying, trading, and managing bullish and bearish flag setups.

1. Understand the Anatomy of Flag Patterns
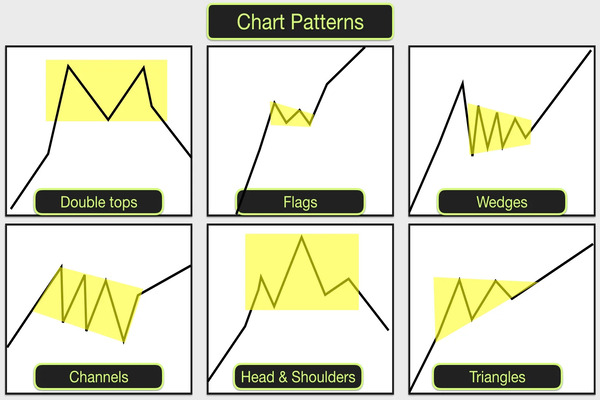
A flag pattern consists of two main components: the flagpole and the flag. The flagpole is a sharp, directional price move—upwards for bullish flags and downwards for bearish flags. The flag itself is a period of consolidation that slopes against the prevailing trend, often forming a small rectangle or channel.
Bullish flag: Follows an uptrend (flagpole), then consolidates downward or sideways (flag), before breaking out higher.
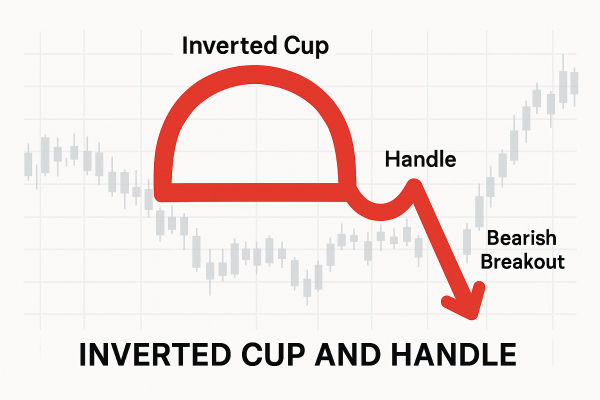
Bearish flag: Follows a downtrend (flagpole), then consolidates upward or sideways (flag), before breaking down lower.
Understanding this structure helps traders distinguish genuine flag patterns from other types of consolidations.
2. Wait for Confirmation Before Entering
Patience is key when trading flag patterns. Do not enter a trade until the price breaks out of the flag's boundary in the direction of the original trend:
For a bullish flag, wait for a breakout above the flag's resistance
For a bearish flag, wait for a breakout below the flag's support.
Confirmation often comes with a surge in volume, indicating strong participation. Entering too early can expose traders to false breakouts and unnecessary losses.
3. Set Stop-Loss and Take-Profit Levels Strategically
Risk management is crucial with flag patterns, as false breakouts can and do occur. Place your stop-loss just outside the opposite side of the flag:
Bullish flag: Stop-loss below the lower flag boundary.
Bearish flag: Stop-loss above the upper flag boundary.
For take-profit, a common method is to measure the flagpole's height and project that distance from the breakout point. This gives a realistic target based on the pattern's momentum.
4. Use Volume to Validate the Pattern
Volume analysis can help confirm the strength of a flag pattern:
During the flagpole, look for high or increasing volume, signalling strong momentum.
During the flag (consolidation), volume should decline, showing a pause in the trend.
At breakout, a spike in volume adds confidence that the move is genuine and likely to continue.
If volume remains low at the breakout, be cautious—this could signal a weak move or a potential trap.
5. Adapt to Market Context and Monitor Trades

Flag patterns are most reliable in strong trending markets. Always assess the broader market context before trading:
Spot a prior trend: Only trade bullish flags in established uptrends and bearish flags in established downtrends.
Monitor your trades: Even after entry, keep an eye on price action and volume. Markets can change quickly, and patterns can fail. Adjust stop-losses or take profits if the market shows signs of reversal or weakness.
Range flags: Price consolidates sideways within a narrow band.
Channel flags: Price consolidates in a sloping channel (downward for bullish, upward for bearish).
Wedge flags: Price consolidates with converging trendlines, indicating building pressure before breakout.
Recognising these variations can help traders spot more opportunities and avoid misinterpreting the pattern.
Bullish and bearish flag patterns are powerful tools for traders seeking to ride trends and manage risk. By understanding the structure, waiting for confirmation, setting strategic stops and targets, using volume for validation, and staying alert to market context, traders can improve their chances of success with these classic continuation patterns.
Disclaimer: This material is for general information purposes only and is not intended as (and should not be considered to be) financial, investment or other advice on which reliance should be placed. No opinion given in the material constitutes a recommendation by EBC or the author that any particular investment, security, transaction or investment strategy is suitable for any specific person.


World's Best Broker