Published on: 2025-06-13
Updated on: 2025-10-30
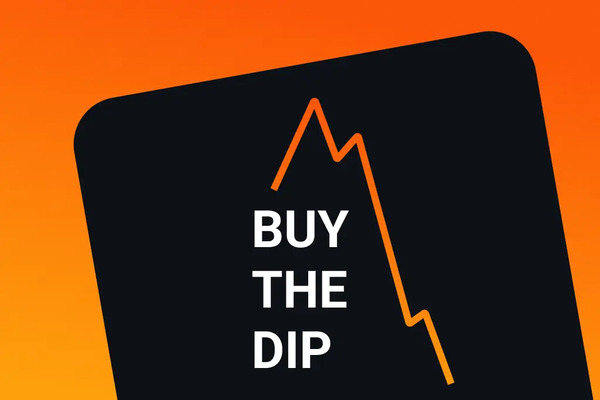
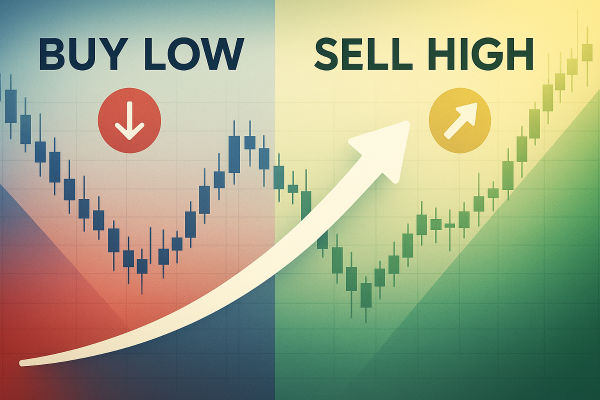
The rule of buy low, sell high remains one of the oldest and most misunderstood principles in investing. It sounds simple, yet in today’s algorithmic and data-driven markets, defining what is truly “low” or “high” requires more than intuition.
Even as technology evolves, market behavior remains rooted in human psychology such as fear pushes prices down, greed drives them up, and these emotions create opportunity.
This guide explains how to apply buy low, sell high effectively in 2025, using practical tools, examples, and risk-managed strategies.

Despite automation and AI tools dominating headlines, markets are still influenced by crowd behavior like overreactions, fear, and greed. This means undervalued entry points and overpriced exits will always exist.
What has changed is access to better data:
Real-time sentiment tracking
Screening for oversold or overbought assets
Global news monitoring to detect panic-driven dips
Used correctly, these resources make timing the market less about luck and more about logic.

A “low” is when an asset trades below intrinsic value due to short-term fear or overreaction. A “high” occurs when price outruns fundamentals or historical norms. The following indicators are normally used to measure market volatility.
RSI (Relative Strength Index): Below 30 = oversold; above 70 = overbought.
Bollinger Bands: Price touching the lower band may signal undervaluation.
200-Day Moving Average: A price 10–20% below this line often signals long-term value.
P/E Ratio Comparison: Compare current valuations against historical averages.
Avoid relying on one indicator. Look for alignment between price signals and business fundamentals.
Example:
Technical: Price rebounds above the 50-day average after weeks of decline.
Fundamental: Strong earnings or guidance confirms improving momentum.
When both agree, conviction in the “buy low” entry strengthens.
Meta Platforms (META)
In January 2025, META fell 18% on regulatory worries. RSI dropped to 27 and price slipped under the 200-day average. Solid ad-revenue results triggered a 14% rebound within two weeks.
Gold (XAU/USD)

In March 2025, gold dipped to $1,890 as the USD strengthened. Long-term trend support and geopolitical risks lifted it back above $2,000 within a month.
Buying is easy; selling requires discipline.
Define exit conditions in advance:
Target profits: Based on resistance zones or fixed gain levels.
Trailing stops: Secure gains as prices rise.
Time-based exits: Close trades that stagnate beyond your planned horizon.
Cheap Does Not Equal Value: A low price is not always a bargain.
Ignoring Risk: Always apply stop losses.
Emotional Trading: Stick to your plan; never chase trends or panic-sell.

Long-Term Investors
Focus on fundamentally strong assets temporarily out of favor due to overreaction or short-term issues.
Example: Early 2025’s renewable-energy slump recovered with double-digit gains after policy clarity returned.
Day Traders
Use intraday charts, volume spikes, and momentum indicators to capture short-term reversals.
Example: A tech stock plunges at market open on misread news; quick buyers profit once sentiment corrects.
Timing the Market vs. Time in the Market
Trying to catch perfect tops and bottoms is nearly impossible. Consistent gains often come from time in the market, not flawless timing.
Short-term traders benefit from technical setups and momentum plays, but long-term investors rely on compounding. The “buy low, sell high” principle applies best when patience complements precision, buying undervalued assets and allowing fundamentals to correct prices over time.
Even Warren Buffett’s approach reflects this: value is identified, not predicted daily.
Even the best “buy low, sell high” setups can fail without proper risk control. Managing downside exposure ensures survival through market volatility.
| Strategy | Purpose | Example |
|---|---|---|
| Stop-Loss Orders | Limit potential losses automatically | Set a stop 5% below entry price |
| Diversification | Spread exposure across asset types | Hold equities, bonds, and gold |
| Position Sizing | Control capital per trade | Risk only 1–2% of portfolio per trade |
| Hedging | Offset risk with inverse positions | Long stock index, short futures |
| Risk-Reward Ratio | Ensure profitable setups outweigh losses | Target 2:1 reward-to-risk |
Disciplined traders view risk management as capital preservation, not missed opportunity. Protecting profits is as important as earning them.
Not every dip equals opportunity. Some declines reflect structural weakness, not temporary emotion.
Common traps include:
Companies with broken business models or mounting debt.
Commodities facing long-term demand erosion.
Cryptos or penny stocks collapsing from speculative excess.
These are value traps, not bargains. Traders must separate temporary fear from fundamental decline by reviewing earnings stability, balance-sheet strength, and industry trends before buying.
“Buy low, sell high” endures because psychology never changes.
Define “low” and “high” using both data and fundamentals.
Manage risk through diversification, sizing, and stops.
Patience and timing together yield consistent results.
Avoid value traps, not every dip deserves your capital.
It’s the practice of buying undervalued assets and selling them once prices rise, capturing profit from market mispricing.
Yes. Traders buy currencies that are undervalued or oversold and sell once exchange rates strengthen.
Yes. When combined with reliable data, technical signals, and proper risk management, it remains one of the most effective long-term trading frameworks.
The buy low, sell high principle remains timeless. In 2025, success comes not from guessing but from combining data, discipline, and timing.
Technology may refine how signals are spotted yet the essence remains unchanged: find value others miss, and exit before the crowd catches on.
Disclaimer: This material is for general information purposes only and is not intended as (and should not be considered to be) financial, investment or other advice on which reliance should be placed. No opinion given in the material constitutes a recommendation by EBC or the author that any particular investment, security, transaction or investment strategy is suitable for any specific person.