The best indicators for intraday trading are Moving Averages (SMA & EMA), RSI, MACD, Bollinger Bands, VWAP, Parabolic SAR, ATR, and volume. These tools help traders identify trends, gauge momentum, measure volatility, and spot potential entry and exit points for smarter, faster trades.
This article highlights the best intraday trading indicators, such as moving averages, RSI, MACD, Bollinger Bands, VWAP, ATR, Parabolic SAR, and volume. Each indicator shows how to identify trends, measure momentum, track volatility, confirm signals, and make smarter decisions in fast-moving intraday markets.
1. The Trend Trackers: Moving Averages
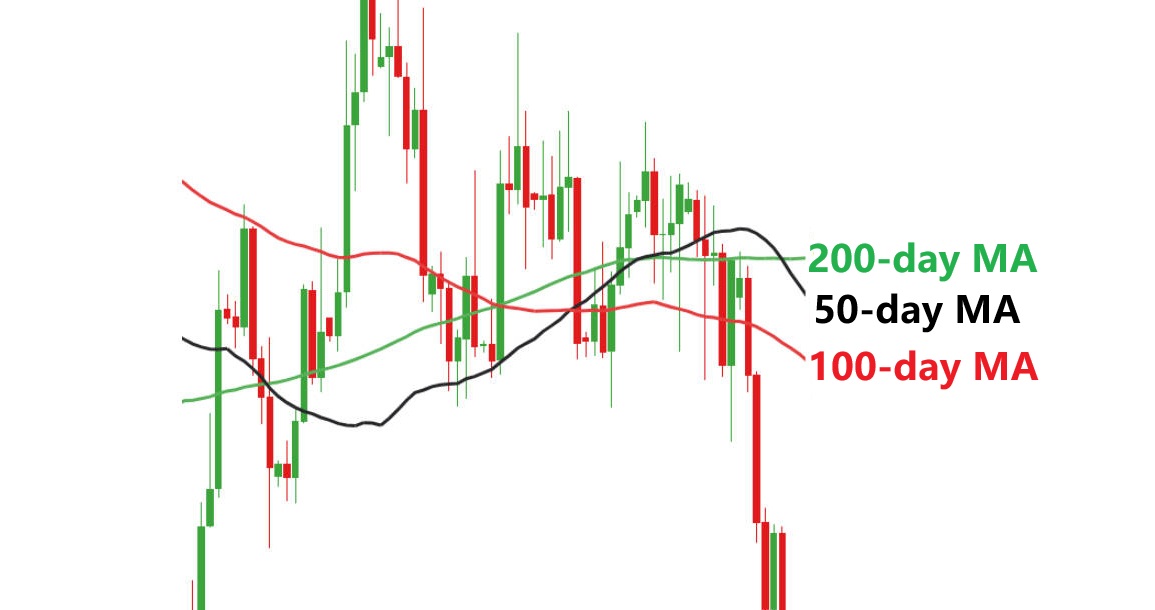
Moving averages (MAs) are among the most widely used indicators for traders at all levels. They smooth out price fluctuations, helping to reveal the underlying trend.
1) Simple Moving Average (SMA):
Calculates the average price over a set period, providing a clear line that tracks overall trend direction. Although slower to react, the SMA is useful for filtering out market "noise."
2) Exponential Moving Average (EMA):
Gives greater weight to recent prices, making it more responsive to new information. EMAs are particularly effective in intraday trading, where timely reactions are crucial.
Application:
Traders use moving averages to identify trend direction, spot reversals, and generate entry or exit signals. For instance, a short-term EMA crossing above a long-term SMA may indicate a bullish trend.
2. The Momentum Master: Relative Strength Index (RSI)
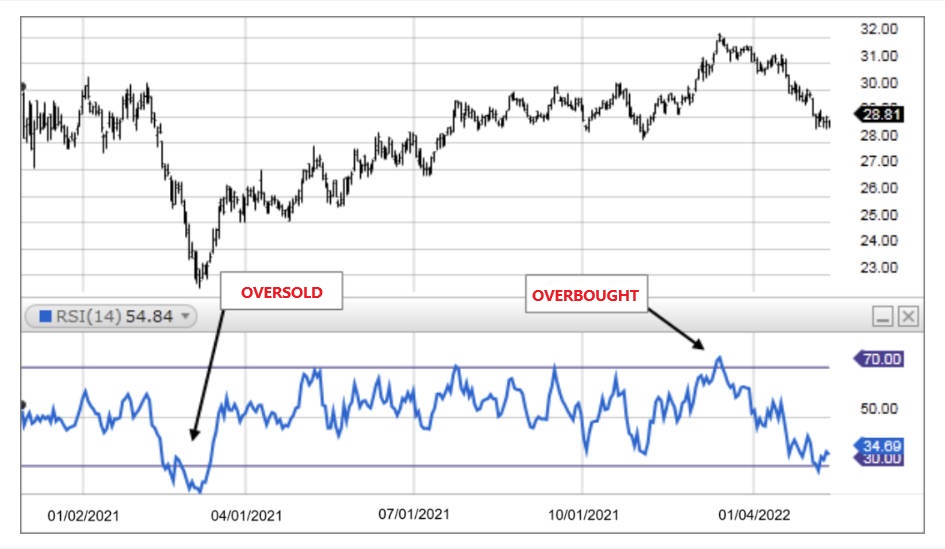
The Relative Strength Index (RSI) is a momentum oscillator that measures the speed and change of price movements. It is particularly useful for identifying overbought and oversold conditions.
Overbought: RSI values above 70 suggest the asset may be overvalued, signalling a potential reversal or pullback.
Oversold: RSI values below 30 indicate undervaluation, often preceding a price increase.
Application:
Traders use RSI to refine entry points and avoid chasing trends, combining it with trend indicators to confirm signals. In intraday trading, RSI can reveal when a price spike is likely to correct.
3. The Trend-Momentum Duo: MACD
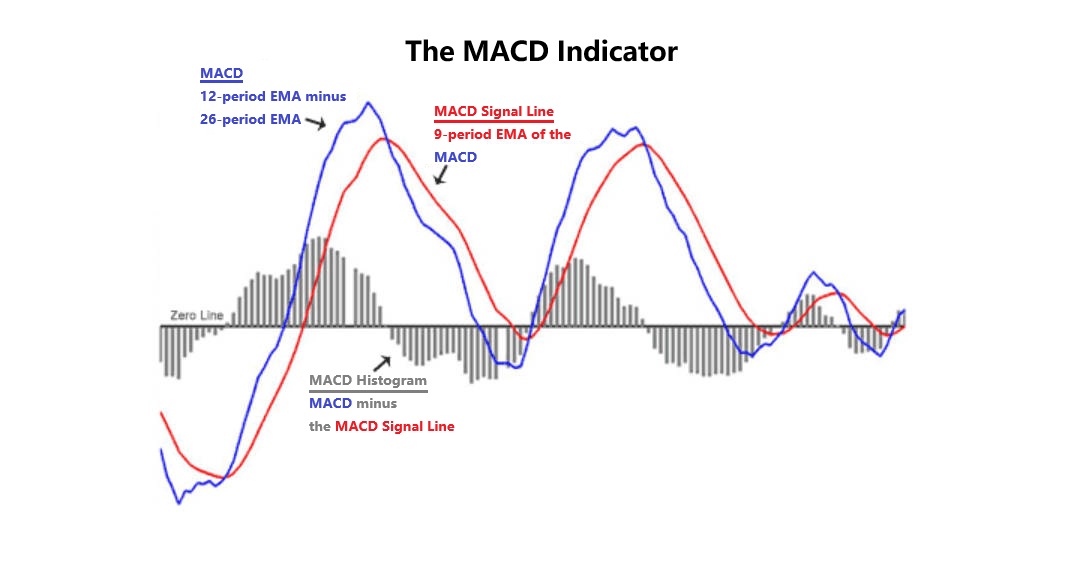
The Moving Average Convergence Divergence (MACD) is a versatile indicator combining trend-following and momentum analysis. It tracks the relationship between two EMAs (typically 12-day and 26-day).
Signals:
Application:
MACD helps traders identify trend direction, strength, and potential reversals. It is particularly valuable for intraday strategies where trend confirmation is essential.
4. The Volatility Whisperer: Bollinger Bands
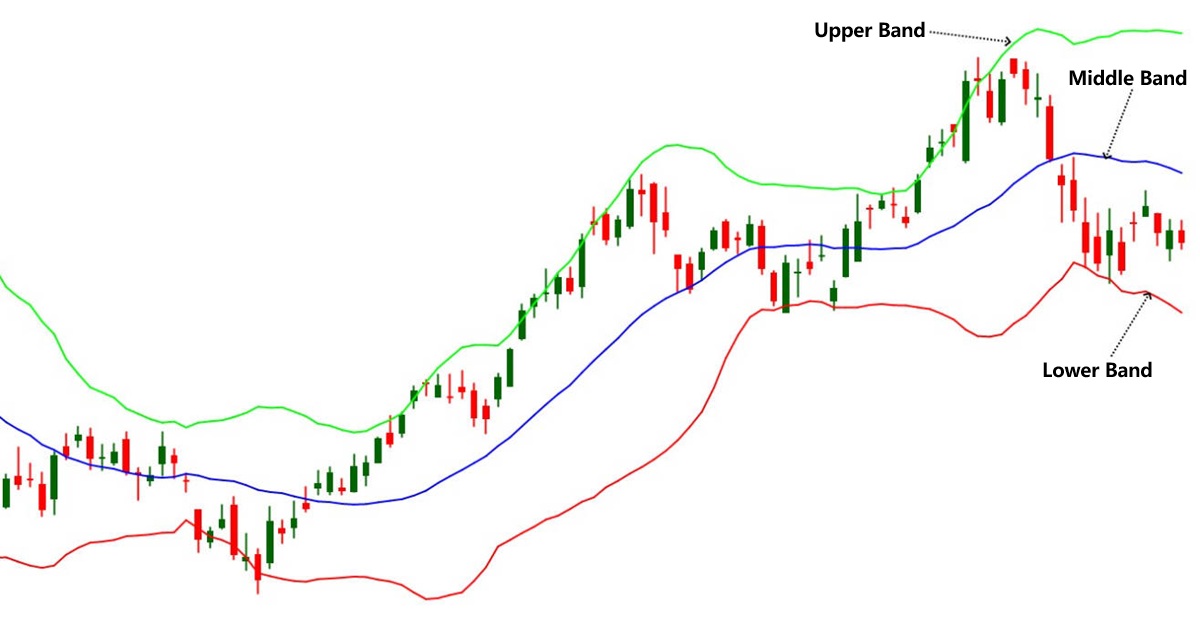
Bollinger Bands consist of a middle band (usually an SMA) and two outer bands set at standard deviations above and below the middle band. These bands expand and contract based on market volatility.
Application:
Bollinger Bands help intraday traders gauge volatility and identify breakout opportunities. They are often combined with momentum indicators like RSI for greater precision.
5. The Volume Validator
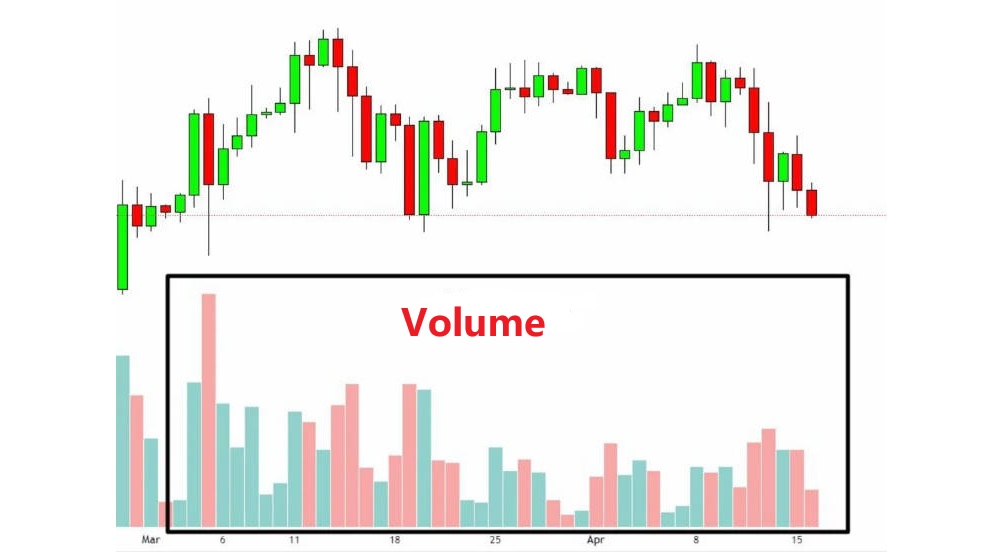
Volume is a measure of how much of a security is traded in a given period and is often an overlooked but essential indicator.
High volume during a price move: Confirms the trend's strength.
Low volume: Indicates a lack of conviction, suggesting potential reversal or consolidation.
Application:
Combining volume analysis with trend and momentum indicators reduces the likelihood of false signals and improves trade timing.
6. The "Smart Average": VWAP
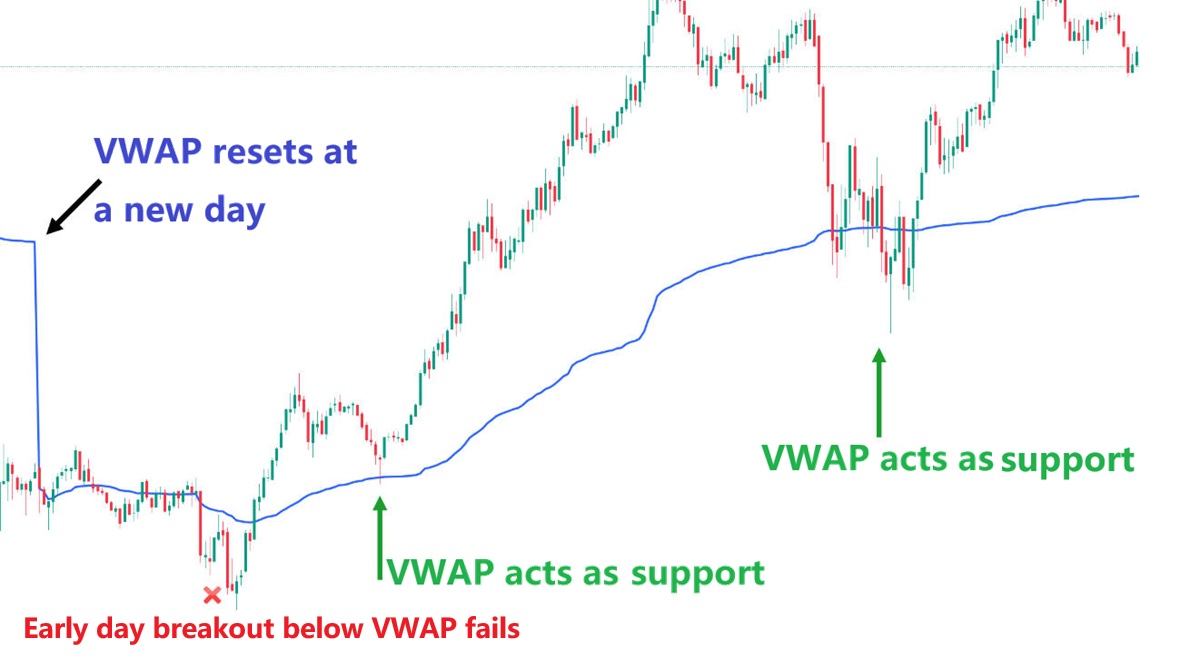
The Volume Weighted Average Price (VWAP) represents the average price a security has traded at throughout the day, weighted by volume. It is widely used by institutional traders.
Application:
VWAP is a key reference point for intraday traders, helping to align trades with overall market direction and evaluate the quality of executions.
7. The Reversal Radar: Parabolic SAR
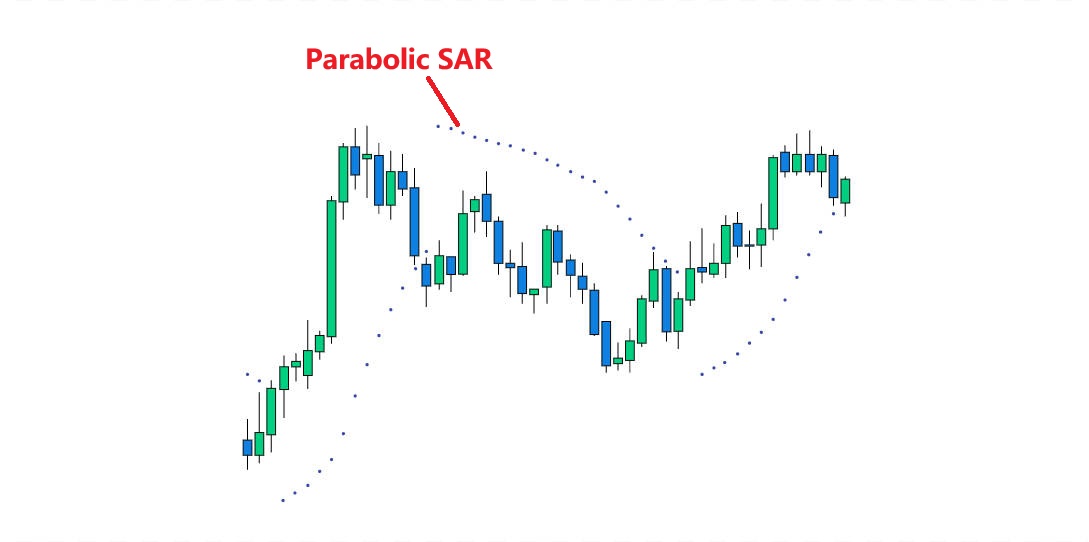
The Parabolic Stop and Reverse (SAR) indicator identifies potential trend reversals by placing dots above or below the price.
Application: This trend-following tool helps intraday traders identify potential exit or entry points in real-time, especially in trending markets.
8. The Candlestick Chronicles
Candlestick patterns provide visual insights into market psychology and short-term price movements.
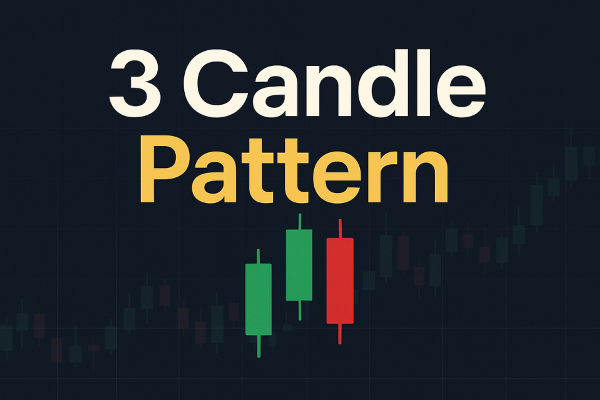
Doji: Market indecision, often a reversal precursor.
Engulfing: Indicates strong reversal potential.
Hammer and Shooting Star: Signposts of bullish or bearish sentiment.
Application:
Candlestick analysis, combined with other indicators, allows intraday traders to fine-tune entries and exits with precision.
9. The Barrier Busters: Support & Resistance
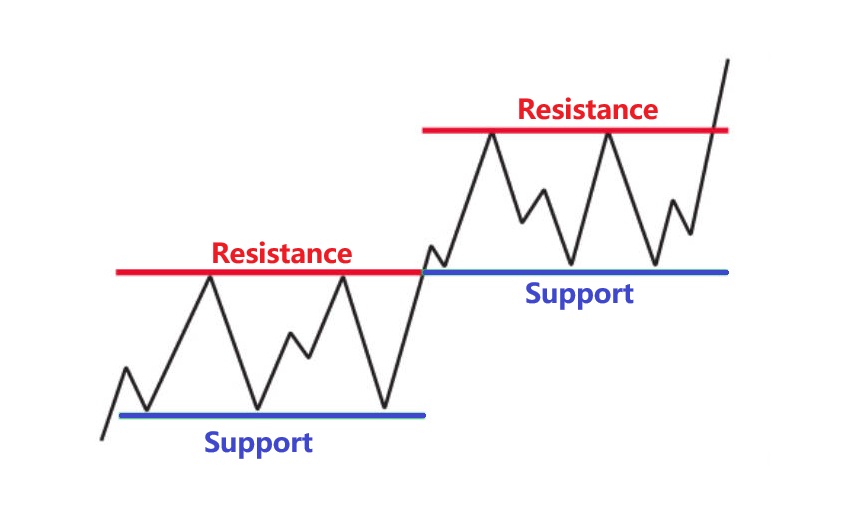
Support and resistance levels are price points where buying or selling pressure historically halts or reverses the trend.
Support: Acts as a floor, preventing further price decline.
Resistance: Acts as a ceiling, limiting price gains.
Application:
Intraday traders use these levels to set targets, stop-loss orders, and anticipate breakout or reversal zones.
10. The Volatility Gauge: Average True Range (ATR)
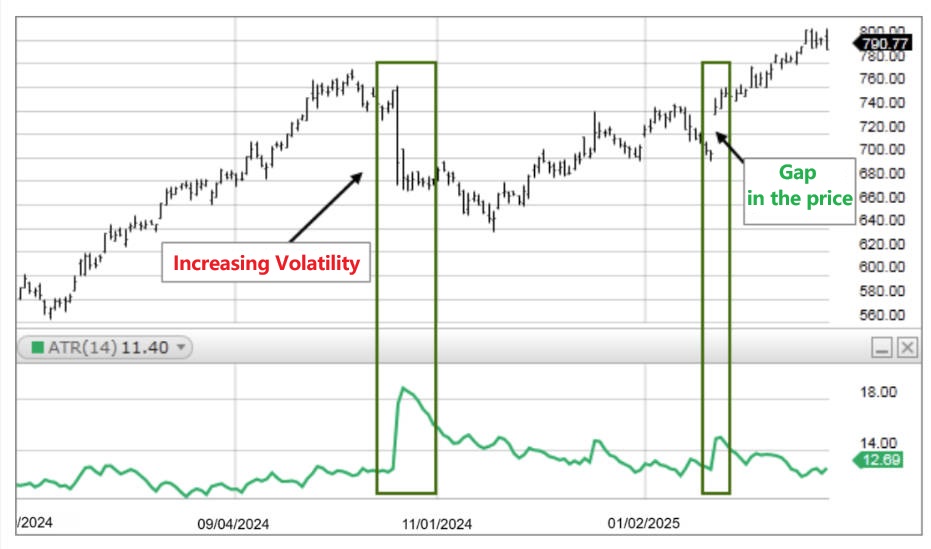
The ATR measures market volatility by calculating the average range between high and low prices over a set period.
Application:
ATR helps intraday traders determine optimal stop-loss placement and position sizing, reducing the risk of being stopped out prematurely.
Practical Tips for Using Indicators in Intraday Trading
1) Combine Indicators:
No single tool provides a complete picture. Combine trend, momentum, volume, and volatility indicators for more reliable signals.
2) Match Indicators to Strategy:
Scalpers may rely more on RSI and VWAP, while day traders might prioritise MACD and Bollinger Bands.
3) Timeframe Awareness:
Short-term indicators react faster but can generate more false signals; always consider the timeframe in use.
4) Discipline and Risk Management:
Even the best indicators cannot guarantee success. Use stop-losses, manage position sizes, and remain disciplined.
Concluison
Intraday trading demands speed, precision, and insight. Using indicators like moving averages, RSI, MACD, Bollinger Bands, VWAP, and ATR helps traders spot trends, measure momentum, and manage risk effectively. When applied wisely, these tools turn fast-moving markets into actionable opportunities.
The Best Intraday Trading Indicators at a glance
| Indicator |
Purpose |
How It Helps Traders |
Best Use |
| SMA & EMA |
Trend tracking |
Reveals market direction and potential reversals |
Identify trend continuation or early reversal signals |
| RSI |
Momentum |
Highlights overbought and oversold conditions |
Time entries and exits |
| MACD |
Trend & Momentum |
Confirms trends and signals reversals |
Combine with trend indicators for confirmation |
| Bollinger Bands |
Volatility |
Measures price extremes and breakout potential |
Spot pullbacks or breakouts |
| VWAP |
Average price |
Shows the weighted average price for the day |
Align trades with market sentiment |
| Parabolic SAR |
Trend reversal |
Signals trend changes with visual dots |
Entry and exit timing in trending markets |
| ATR |
Volatility |
Quantifies market movement |
Set stop-losses and position sizing |
| Volume |
Confirmation |
Confirms strength of price moves |
Validate trends and signals |
Frequently Asked Questions
Q1: Which indicator is best for identifying trends in intraday trading?
Moving Averages, especially the Exponential Moving Average (EMA), are effective for identifying trends due to their responsiveness to recent price changes.
Q2: How can I determine overbought or oversold conditions?
The Relative Strength Index (RSI) is commonly used, with readings above 70 indicating overbought conditions and below 30 indicating oversold conditions.
Q3: What role does volume play in intraday trading?
Volume confirms the strength of a price move; increasing volume during an uptrend suggests strong buying interest, while increasing volume during a downtrend indicates strong selling interest.
Q4: Are there any indicators tailored for specific markets or instruments?
Yes, indicators like the Average True Range (ATR) and Parabolic SAR can be customized for different markets, including stocks, forex, and cryptocurrencies, to assess volatility and potential reversals.
Disclaimer: This material is for general information purposes only and is not intended as (and should not be considered to be) financial, investment or other advice on which reliance should be placed. No opinion given in the material constitutes a recommendation by EBC or the author that any particular investment, security, transaction or investment strategy is suitable for any specific person.
