Published on: 2025-05-29
Updated on: 2026-07-02
The Bear Flag pattern is one of the clearest bearish continuation signals in technical analysis. It helps traders judge whether a market rebound is a genuine reversal or simply a pause before the next move lower.
Across forex, commodities, indices, and crypto, sharp selloffs are often followed by temporary rebounds that appear convincing but fail near resistance. A well-formed Bear Flag pattern gives traders a structured way to read that price action, confirm momentum, and manage risk before entering a trade.

A Bear Flag pattern is a bearish continuation pattern that appears after a strong price decline. It suggests that sellers remain in control, even though price temporarily consolidates or moves slightly higher.
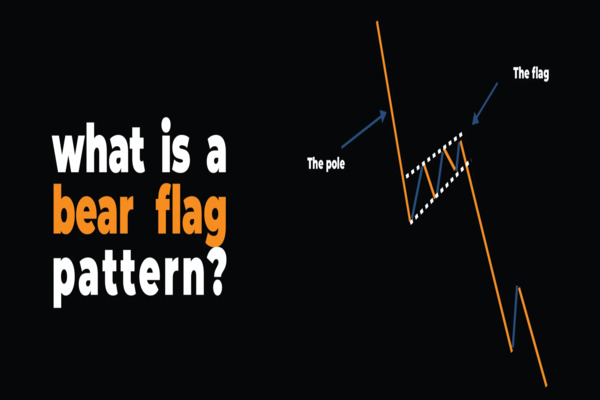
The Bear Flag consists of two components:
The flagpole: a sharp downward move that shows strong selling pressure.
The flag: a short consolidation phase, usually moving sideways or slightly upward inside a narrow channel.
The pattern is confirmed when price breaks below the flag's lower boundary. Traders often interpret this breakdown as a sign that the previous downtrend may continue.
The Bear Flag does not predict every market decline. It works best when it appears inside an existing downtrend, forms after a decisive selloff, and breaks lower with clear confirmation.
| Advantages | Disadvantages |
|---|---|
| Gives a clear bearish continuation signal | Can fail in choppy or range-bound markets |
| Works across forex, stocks, commodities, indices, and crypto | Requires confirmation before entry |
| Provides logical entry, stop-loss, and target areas | False breakouts are common during low liquidity |
| Helps traders avoid chasing the first selloff | Deep retracements can weaken the pattern |
| Supports disciplined risk management | Should not be used without broader market context |
The main advantage of the Bear Flag pattern is structure. Instead of reacting emotionally after a sharp fall, traders can wait for price to pause, define support and resistance, and act only after confirmation.
The main risk is assuming that every weak rebound is a Bear Flag. A valid pattern needs a strong flagpole, a controlled consolidation, and a clear breakdown. Without those elements, the setup becomes less reliable.

A Bear Flag pattern is easy to recognise once traders understand its structure. Traders should focus less on finding a perfect drawing and more on whether the price structure reflects weakening buying pressure.
The flagpole is the first major move. It should be a sharp decline with strong bearish momentum. On a chart, this often appears as a series of large red candles, limited pullbacks, or a break below an important support level.
A stronger flagpole usually has:
fast downside movement,
rising volatility,
wider candle ranges,
heavier volume where available,
clear bearish momentum from indicators such as RSI or MACD.
In forex and CFD markets, volume may not always be reliable. Traders can use volatility, candle size, ATR expansion, or momentum indicators as supporting evidence.
After the sharp decline, price begins to consolidate. This is the flag. It usually forms as a small upward-sloping or sideways channel.
The flag should be shorter and weaker than the flagpole. If price retraces too much of the earlier decline, the pattern becomes less convincing. A shallow rebound suggests buyers are struggling to reverse the move. A deep rebound suggests sellers may be losing control.
A healthy flag often shows reduced momentum. Volume may decline, candles may become smaller, and price may struggle near short-term resistance such as the 20-period or 50-period moving average.
The Bear Flag pattern is not complete until price breaks below the flag's lower boundary. This is the confirmation point.
A stronger breakdown usually includes:
a candle close below flag support,
renewed bearish volume or volatility,
RSI staying below 50,
MACD remaining negative or turning lower,
price failing to reclaim the broken flag support.
Some traders enter on the breakout candle. Others wait for a retest of the broken flag support. A failed retest often gives cleaner confirmation because the old support becomes new resistance.
A common method is to measure the length of the flagpole and project it downward from the point of breakdown. This creates a measured-move target.
However, traders should also check nearby support levels. If a major demand zone appears before the measured target, it may be more realistic to take partial profits earlier.
Assume EUR/USD falls sharply from 1.0900 to 1.0750 after stronger US Dollar momentum. This 150-pip decline forms the flagpole.
Price then slowly rebounds to 1.0800 within a tight rising channel. The recovery lacks momentum, RSI remains below 50, and price fails near the 50-period moving average. This forms the flag.
If EUR/USD breaks below the lower channel boundary near 1.0765 and closes there, the Bear Flag pattern is confirmed. A trader may project part or all of the 150-pip flagpole from the breakdown point, while placing a stop above the flag’s upper boundary or the most recent lower high.
The setup only becomes actionable after the breakdown confirms that sellers have regained control.

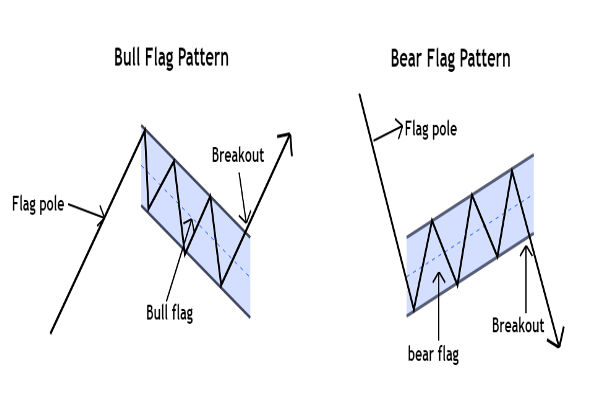
| Pattern | Shape | Meaning |
|---|---|---|
| Bear Flag | Small parallel channel after a sharp decline | Sellers pause before potential continuation |
| Bear Pennant | Small triangle after a sharp decline | Volatility compresses before potential continuation |
Despite their different shapes, both patterns attempt to capture the same market behaviour: a pause in a downtrend before potential continuation. The Bear Flag is often easier for beginners to identify because its channel boundaries are clearer.
The first mistake is entering too early. Many traders sell while price is still inside the flag, hoping to catch the breakdown. This can lead to losses if the market continues to rise or reverses.
The second mistake is ignoring the broader trend. A Bear Flag works best in an existing downtrend. If the market is moving sideways or sitting near major support, the pattern is less reliable.
The third mistake is accepting any rebound as a flag. A valid Bear Flag should be controlled and relatively short. If the rebound retraces most of the flagpole, the bearish continuation signal weakens.
The fourth mistake is using no invalidation point. A Bear Flag fails when price breaks down but quickly moves back into the flag, or when price rises above the upper flag boundary. Traders should define this level before entering.
The final mistake is over-leveraging. Even a good technical setup can fail. Position size should be based on account risk, not confidence in the pattern.
A Bear Flag pattern works best when traders combine structure, confirmation, and risk management.
Entry point: Consider entry only after price breaks below the lower boundary of the flag. Conservative traders may wait for a failed retest of the broken support.
Stop-loss placement: A common stop-loss area is above the flag’s upper boundary or above the most recent lower high. This level marks where the bearish structure is likely invalidated.
Profit target: Measure the flagpole and project the distance from the breakdown point. Traders may also use nearby support levels as partial profit areas.
Confirmation signals: Look for bearish candle closes, rising volatility, weaker RSI, negative MACD, or rejection from short-term moving averages.
Risk management: Avoid risking too much capital on one setup. Many disciplined traders limit risk to a small fixed percentage of account equity. The pattern should also be avoided around major news events if spreads and volatility are likely to widen.
Invalidation rule: If price breaks lower but quickly moves back above the flag support, the setup weakens. If price breaks above the flag itself, the bearish continuation idea is usually invalid.
The Bear Flag pattern is bearish. It usually appears after a strong decline and signals that the market may continue lower after a short consolidation.
The Bear Flag pattern can be reliable in strong downtrends, but it is not guaranteed. It works best when the flagpole is sharp, the flag is controlled, and the breakdown is confirmed by momentum or volume.
A Bear Flag is confirmed when price closes below the lower boundary of the flag. Stronger confirmation comes from rising volume, wider candle ranges, a weak RSI, a bearish MACD, or a failed retest of the broken support.
A common stop-loss level is above the flag’s upper boundary or above the latest lower high. This helps define the invalidation point if the bearish continuation setup fails.
A Bear Flag forms inside a small parallel channel. A Bear Pennant forms inside a small triangle with converging trendlines. Both are bearish continuation patterns.
Yes. A Bear Flag can fail if price breaks lower without momentum, returns quickly into the flag, or breaks above the upper flag boundary. This is why confirmation and risk management are essential.
The Bear Flag remains popular because it translates bearish momentum into a structured trading setup with defined entry, stop and target levels.
The best setups have a strong flagpole, a tight flag, and a decisive breakdown. Confirmation signals such as volume, RSI, MACD, moving averages, and failed retests can improve signal quality.
In volatile markets, the Bear Flag should never be treated as a standalone guarantee. It works best as part of a disciplined trading plan with defined entry, exit, stop-loss, and invalidation rules.
Disclaimer: This material is for general information purposes only and is not intended as (and should not be considered to be) financial, investment or other advice on which reliance should be placed. No opinion given in the material constitutes a recommendation by EBC or the author that any particular investment, security, transaction or investment strategy is suitable for any specific person.