Published on: 2025-07-01
In the world of technical analysis, the pennant pattern is a key chart formation that traders often look for. This pattern appears after a sharp price movement—up or down—and is followed by a brief period of consolidation.
The pattern takes the shape of a small, symmetrical triangle that narrows as the price action compresses. This setup is typically considered a continuation pattern, suggesting that after the consolidation phase, the price is likely to continue in the direction of the prior trend.
Understanding how the pennant pattern works can give traders an edge in predicting market movements. In this article, we'll break down what the pennant pattern is, how to identify it, and how to trade it successfully.

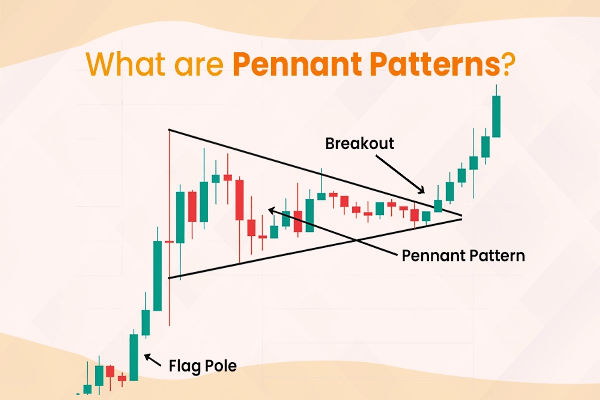
The pennant pattern forms after a strong price move, often referred to as the "flagpole." This initial surge in price is followed by a period of consolidation, where the price moves within two converging trendlines, forming the "pennant." During this consolidation, the volume typically decreases as traders wait for the next move.
Once the price breaks out of the pennant formation—either above the upper trendline or below the lower one—it often signals that the previous trend will continue. A breakout above the pennant is generally a bullish signal, while a breakout below it tends to be bearish.
This pattern is used by traders across various markets, including stocks, forex, and cryptocurrencies, to identify potential continuation trades.

To spot a pennant pattern, you need to look for a few key elements on the chart. First, there must be a strong price move—either upward or downward. This sharp price movement creates the "flagpole" and is the first signal that the pennant pattern may be forming.
Once the price begins to consolidate, the chart will show a symmetrical triangle. The price will move within these two converging trendlines, and volume will typically decrease as the consolidation continues. This phase can last for a few days or weeks, depending on the timeframe you're trading.
After the consolidation, the breakout will occur, typically accompanied by an increase in volume. This is the signal traders wait for to confirm the pattern and make their move.
Once you identify a pennant pattern, the next step is deciding how to trade it. Generally, the idea behind trading this pattern is to wait for the breakout. If the breakout is to the upside, it's a bullish signal; if it's to the downside, it's a bearish signal.
For traders looking to enter a position, the optimal strategy is to wait for the price to break out of the pennant and confirm the direction of the move. After the breakout, the price will often follow the previous trend, making it a continuation pattern.
One of the most common ways to determine the potential price target after a breakout is to measure the height of the "flagpole"—the strong price move before the consolidation—and project that distance from the breakout point. This can help set realistic expectations for the trade.
It's crucial, however, to use a stop-loss when trading the pennant pattern. If the breakout doesn't materialise or turns out to be false, the price may reverse. A stop-loss order can help limit potential losses in these cases.

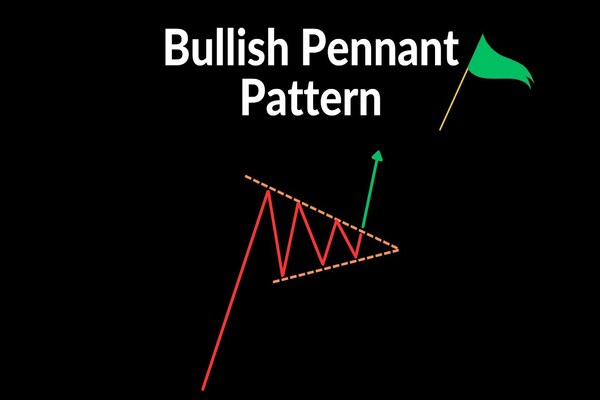
A bullish pennant pattern occurs after a sharp upward price movement, followed by consolidation. When the price breaks above the upper trendline of the pennant, it typically signals that the uptrend will continue. This type of pennant is commonly used by traders to enter long positions.
On the other hand, a bearish pennant pattern forms after a significant downward price movement. As the price consolidates within the pennant, traders wait for a breakout below the lower trendline. A breakdown from the pennant is seen as a continuation of the downward trend, and traders might consider entering short positions.
While the pennant pattern can be a reliable trading signal, it's important to avoid a few common mistakes. One mistake is entering a trade too early, before the breakout occurs. Patience is crucial when trading the pennant pattern. Entering the trade before the breakout can lead to false signals, which may cause unnecessary losses.
Another pitfall is ignoring volume. A breakout accompanied by low volume can indicate a lack of strength in the move, meaning the breakout may not hold. Traders should always ensure that volume increases during the breakout to confirm the signal.
Finally, trading in choppy or sideways markets can result in false breakouts. The pennant pattern works best in trending markets, where a strong prior trend sets the stage for the consolidation phase.
The pennant pattern is a useful chart pattern that can help traders identify continuation trades after a strong price move. By spotting the pattern, waiting for the breakout, and using proper risk management strategies, traders can leverage this formation to capitalise on potential market moves.
Whether you're trading stocks, forex, or cryptocurrencies, understanding how the pennant pattern works can enhance your technical analysis toolkit and improve your trading strategy.
Disclaimer: This material is for general information purposes only and is not intended as (and should not be considered to be) financial, investment, or other advice on which reliance should be placed. No opinion given in the material constitutes a recommendation by EBC or the author that any particular investment, security, transaction, or investment strategy is suitable for any specific person.