Published on: 2026-05-20
Updated on: 2026-05-20
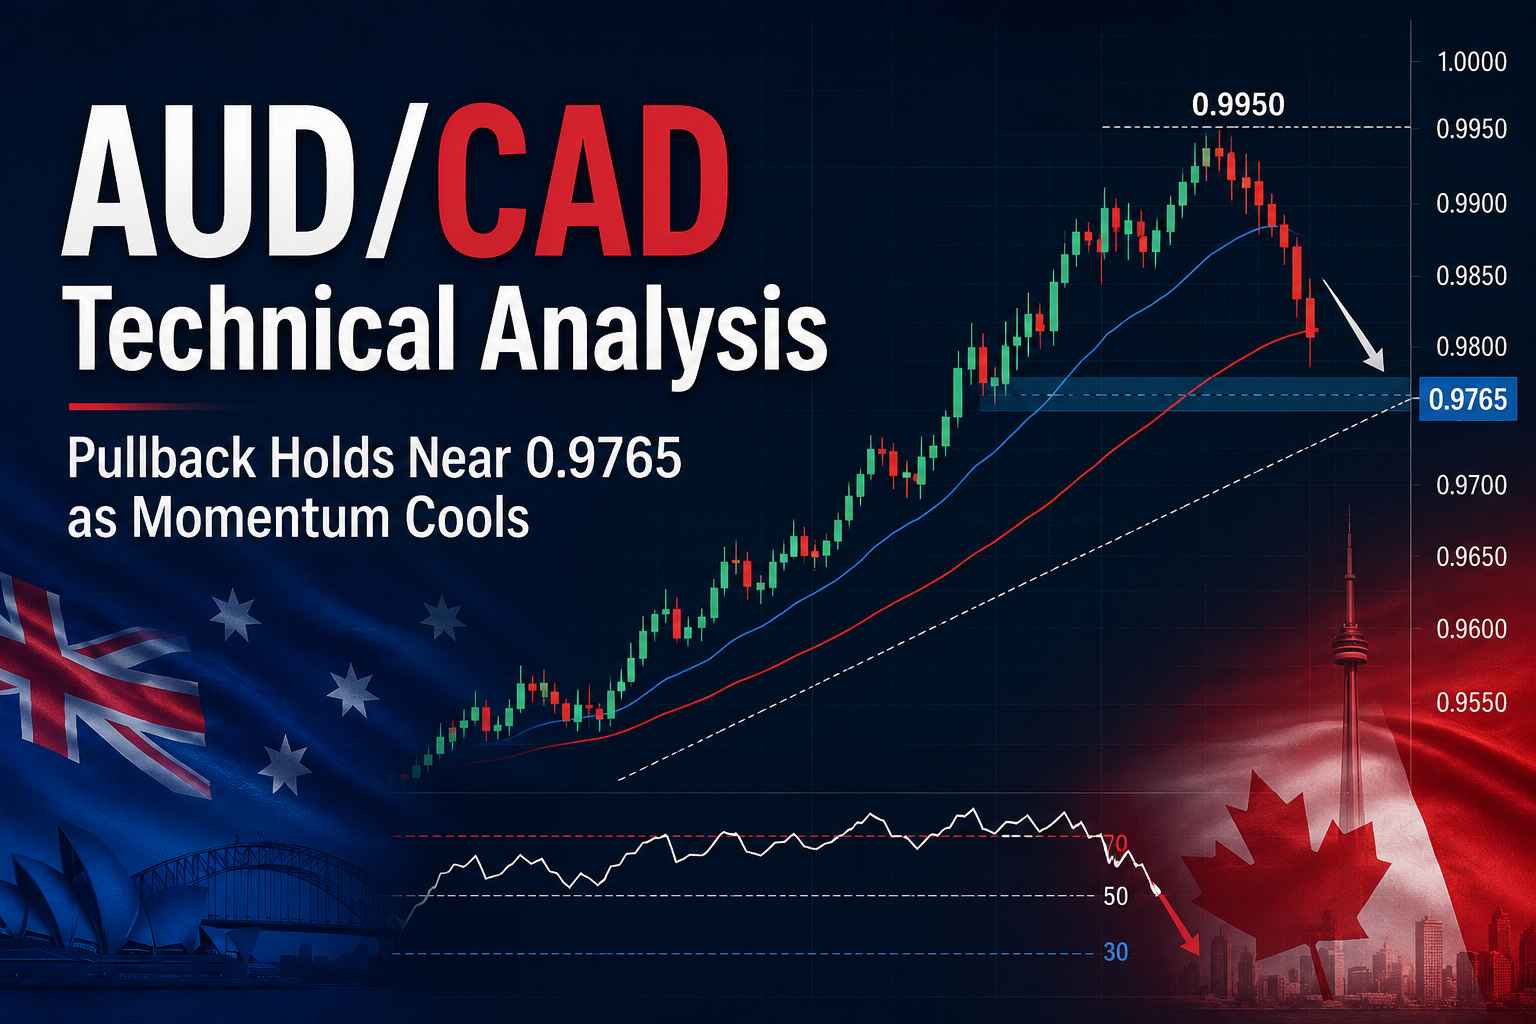
AUD/CAD technical analysis has shifted from breakout momentum to correction management.
As of May 20, 2026, Australian Dollar to Canadian Dollar is trading near 0.9765, after retreating from the 2026 high of 0.9949 recorded on May 13. The move leaves price below its recent high but still well above the January 2026 low of 0.9159, preserving the broader recovery structure while weakening the short-term trend profile.

The technical picture is mixed rather than outright bearish. Daily indicators have turned negative, while the larger chart still reflects the higher-high and higher-low structure that began earlier in 2026. The latest price action shows the market testing whether the broader recovery can absorb a deeper retracement without breaking its medium-term structure.
The rejection from the 0.9950 area matters because it occurred just below the psychological parity zone and near the 2021 resistance region around 0.9990. That creates a visible supply band between 0.9950 and 1.0000, where profit-taking and fresh short-term selling pressure have capped the advance.
The pullback into 0.9765 is not a trend reversal by itself. It is a test of structure. A correction after a multi-week climb is technically normal, but the speed of the decline from 0.9949 to the current spot area shows that upside momentum has faded.
Price is now trading close to the lower end of the current May range, with 0.9720 to 0.9721 acting as the first level that separates orderly consolidation from a broader downside extension.
The intraday range is narrow, with AUD/CAD trading between 0.9752 and 0.9775 so far on May 20. That controlled range suggests the pair is consolidating after the recent decline rather than entering a disorderly volatility break.
| Indicator | Latest Reading | Technical Interpretation |
|---|---|---|
| Spot area | 0.9765 | Price is holding near short-term support |
| Intraday range | 0.9752 to 0.9775 | Narrow range shows controlled consolidation |
| RSI 14 | 34.49 | Selling pressure is elevated, but not deeply oversold |
| MACD 12,26 | -0.001 | Momentum has turned negative |
| ATR 14 | 0.0014 | Volatility remains contained |
| MA 20 | 0.9781 SMA, 0.9784 EMA | Price below this zone keeps short-term pressure intact |
| MA 50 | 0.9810 SMA, 0.9810 EMA | Reclaiming this area would improve the recovery structure |
| MA 100 | 0.9850 SMA, 0.9835 EMA | Acts as overhead dynamic resistance |
| MA 200 | 0.9876 SMA, 0.9847 EMA | Long-period resistance remains below the May high |
| Immediate support | 0.9721 | Key downside validation level |
| Immediate resistance | 0.9780 to 0.9810 | First moving-average recovery band |
The RSI reading near 34.49 confirms bearish pressure, but it has not reached an extreme oversold threshold. MACD below zero shows fading momentum, while the low ATR indicates that the retracement remains controlled.
The moving-average profile is the main technical concern, as price remains below the 20, 50, 100 and 200-period averages on the daily technical dashboard.
The first support zone sits near 0.9721. A firm daily close below that level would weaken the corrective structure and bring the March swing area near 0.9554 back into view. That 0.9550 to 0.9560 region has previous price memory and remains the next important demand zone if sellers extend the current retracement.
Resistance is layered. The first recovery barrier is the 0.9780 to 0.9810 region, where the 20 and 50-period moving averages are clustered.
Above that, 0.9850 becomes the next technical checkpoint, followed by 0.9949 to 0.9950. Only a sustained recovery through the May high would place the parity zone back into technical focus.
| Zone | Level | Market Meaning |
|---|---|---|
| Major resistance | 0.9990 to 1.0000 | Historical ceiling and parity zone |
| May high | 0.9949 | Recent rejection point |
| Recovery resistance | 0.9850 | 100-period moving-average region |
| Short-term resistance | 0.9780 to 0.9810 | Moving-average cluster |
| Current spot area | 0.9765 | Consolidation after pullback |
| Intraday support | 0.9752 | Current session low |
| Pivot support | 0.9721 | Correction validation level |
| Deeper support | 0.9550 to 0.9554 | Prior swing support zone |
The correction is occurring against a two-sided macro backdrop. The Reserve Bank of Australia raised the cash rate by 25 basis points to 4.35% on May 5, citing stronger inflation pressure and the impact of higher fuel and commodity prices.
That remains supportive for AUD rate differentials, but the RBA also signalled data dependence after three rate increases, reducing the urgency of further hawkish repricing.
The Canadian Dollar is receiving support from oil-sensitive positioning. Canada’s terms of trade tend to improve when crude prices rise, which can cushion CAD even when AUD holds a higher policy-rate advantage. That explains why AUD/CAD has struggled to sustain the move above 0.9900 despite the broader Australian Dollar recovery.
For technical traders, the macro backdrop matters mainly because it influences the strength of support and resistance reactions. A firmer CAD tone makes the 0.9780 to 0.9810 recovery band harder to clear, while AUD support from rate differentials may help contain selling near 0.9721 unless momentum accelerates.
AUD/CAD is currently defined by a short-term bearish correction inside a broader bullish structure. The technical bias stays defensive while price trades below the 0.9780 to 0.9810 moving-average cluster.
A recovery above that band would reduce immediate selling pressure, while another rejection from the same zone would show that sellers are defending the first rebound.
The 0.9721 level is the main downside marker. Holding above it keeps the correction contained. Breaking below it would shift the chart from consolidation into a deeper retracement phase, with 0.9550 to 0.9554 acting as the next important demand area. This remains a level-based technical assessment, not a directional forecast.
AUD/CAD is short-term bearish but medium-term constructive. Daily technical indicators have turned negative, while the broader 2026 price structure still shows a recovery from the January low to the May high.
The key support level is 0.9721. A daily close below this area would weaken the current correction structure and expose the 0.9550 to 0.9554 support zone.
Immediate resistance sits between 0.9780 and 0.9810. A stronger recovery would need to clear 0.9850 before the May high near 0.9949 becomes relevant again.
RSI near 34.49 shows selling pressure but not extreme oversold conditions. This supports the view that the pair is correcting, with momentum weakened but not fully exhausted.
AUD/CAD is no longer in a clean upside extension. The retreat from 0.9949 has pulled price into a technical decision zone near 0.9765, where moving averages, momentum indicators and prior support levels now matter more than the previous breakout narrative. The immediate structure remains defensive below 0.9810, while 0.9721 is the key level that determines whether the correction remains contained or develops into a deeper retracement.
RBA cash rate decision: https://www.rba.gov.au/media-releases/2026/mr-26-12.html
Bank of Canada policy rate decision: https://www.bankofcanada.ca/2026/04/fad-press-release-2026-04-29/
EIA Short-Term Energy Outlook: https://www.eia.gov/outlooks/steo/