Published on: 2025-08-08
Updated on: 2026-08-21
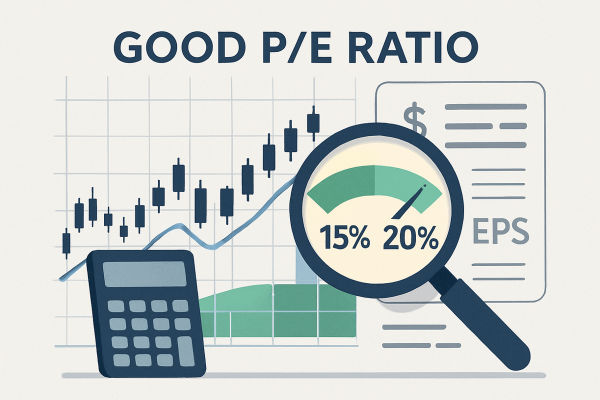
What is a good P/E ratio? There is no universal number. For a mature, profitable company, 15x to 20x can provide a rough starting reference, but growth, sector and earnings direction determine whether that multiple is actually cheap or expensive.
A 12x stock can cost too much if profits are about to fall, while 30x can be reasonable when earnings are growing fast enough to justify the premium.
No P/E is good in isolation. Compare it with the company’s growth, sector peers, historical valuation and the broader market.
The S&P 500 traded at 20.0x forward earnings in FactSet’s August 7, 2026 snapshot, versus 19.9x over five years and 19.0x over ten years.
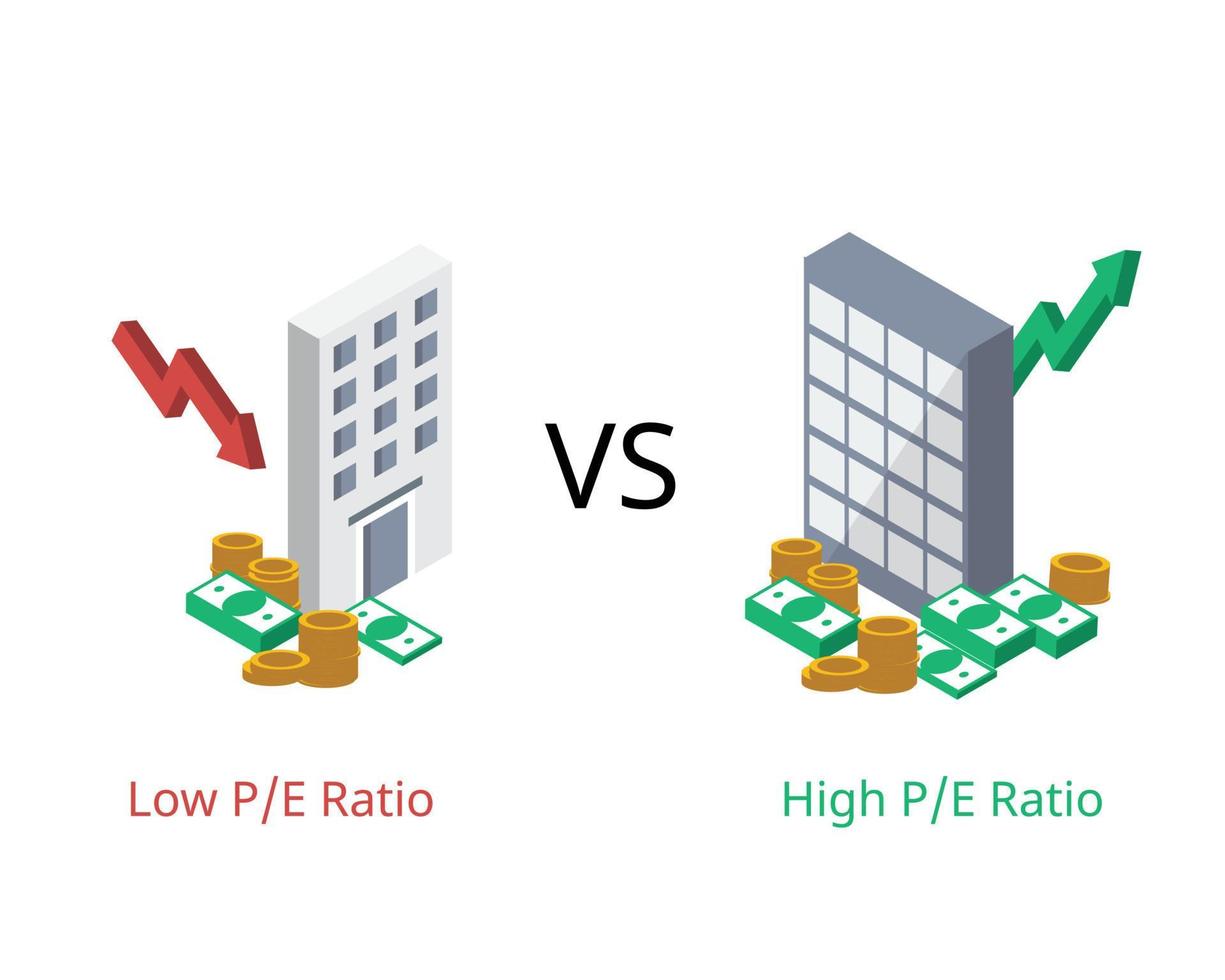
A low P/E can signal value or deteriorating profits, while a high multiple can reflect excessive expectations or durable growth.
Trailing and forward P/E can produce very different valuations because one uses reported earnings and the other relies on forecasts.
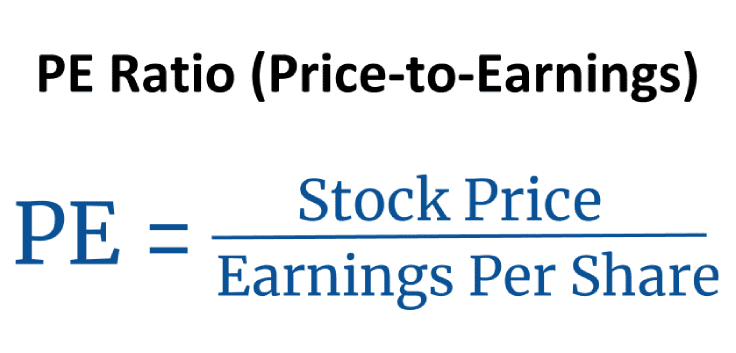
The price-to-earnings ratio shows how much the market is paying for each $1 of company earnings.
P/E ratio = Share price ÷ Earnings per share
A company trading at $100 with earnings per share of $5 has a P/E of 20x. The market is valuing each $1 of annual earnings at $20.
The calculation is straightforward. The harder question is whether those earnings can grow fast enough to justify the multiple. Changes in earnings per share can alter the P/E substantially even when the share price barely moves.
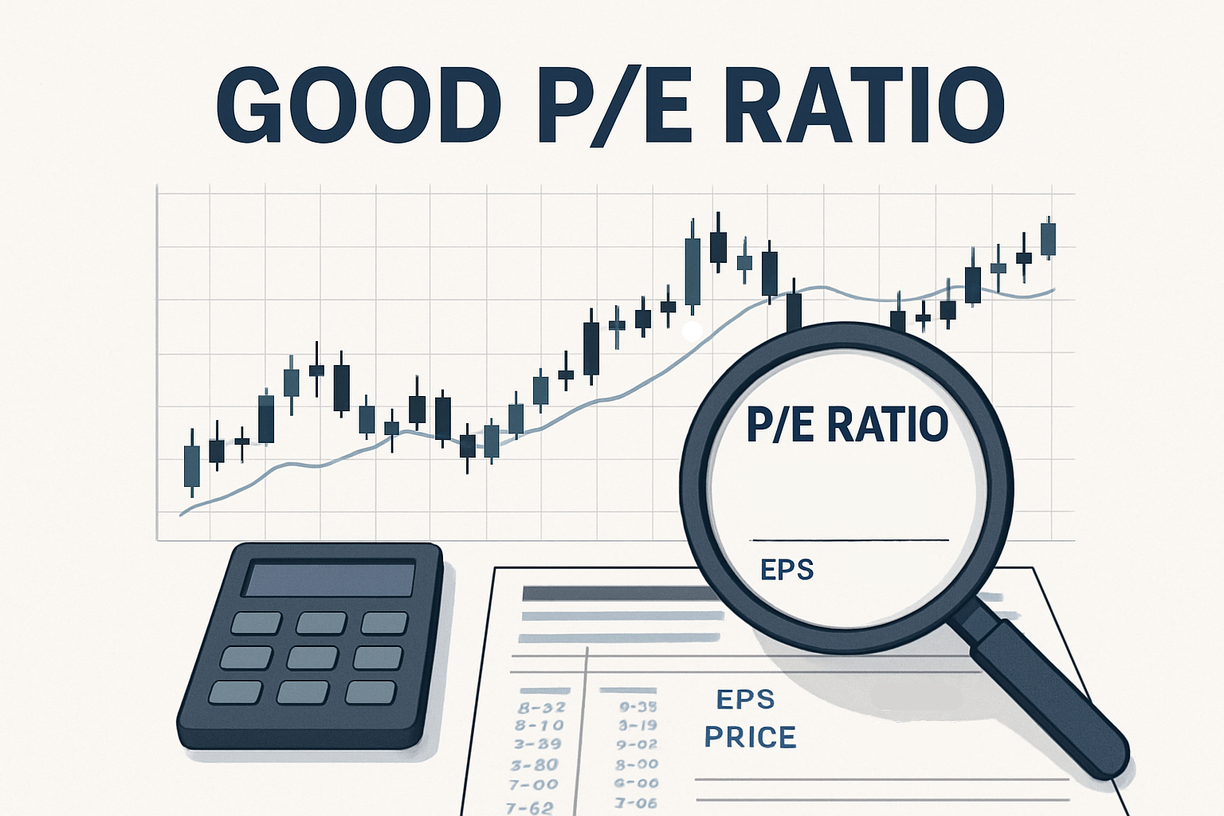
A P/E number becomes useful only after comparison. A company at 25x may look expensive against its own historical average of 15x, yet attractive beside similar businesses trading at 35x if their growth profiles are comparable.
The four most useful reference points are the company’s historical valuation, comparable businesses, expected earnings growth and the broader market. A valuation viewed without those comparisons says surprisingly little about whether a stock is cheap.
The latest FactSet snapshot placed the S&P 500 at 20.0x forward earnings, almost level with its five-year average of 19.9x and above its ten-year average of 19.0x. A company trading at 20x forward earnings is therefore close to the current US market benchmark, but its growth and risk may justify a very different valuation.
Businesses with different growth rates, capital requirements and earnings stability rarely deserve the same multiple.
US industry data from January 2026 showed forward P/E ratios of about 37.3x for semiconductors, 34.1x for system and application software, and 13.0x for money-centre banks. A 20x forward P/E would therefore sit well below the semiconductor benchmark but substantially above the banking figure.
Sector comparison does not determine fair value, but it prevents a common mistake. A stock should not be labelled expensive simply because its P/E exceeds an arbitrary market-wide threshold.
These ranges provide a first reading rather than a valuation verdict.
| P/E | First reading | Check next |
|---|---|---|
| Below 10x | Low multiple | Falling profits or cyclical peak |
| 10x to under 20x | Moderate multiple | Growth, peers and debt |
| 20x to under 30x | Growth premium | Future EPS growth |
| 30x to under 40x | High expectations | Margin and growth durability |
| 40x+ | Very high expectations | How much success is already priced in |
The same multiple can carry opposite meanings in different businesses. A company growing earnings at 4% deserves a different valuation from one compounding profits at 25%, even if both report identical earnings today.
Trailing P/E uses earnings from the previous 12 months. Forward P/E divides the current share price by estimated earnings for the coming 12 months. Trailing earnings are known, while forward earnings are more relevant to the future but depend on forecasts that can be wrong.
Consider a $100 stock with trailing EPS of $4. Its trailing P/E is 25x. If expected EPS rises to $5.50 next year, its forward P/E falls to about 18.2x.
The stock looks expensive against past earnings and far less demanding against expected profits. A large gap between trailing and forward P/E should prompt scrutiny of the earnings forecast rather than an automatic conclusion that the stock is cheap.
Low multiples become dangerous when current earnings are temporarily high.
Consider a cyclical company earning $10 per share at a $120 share price. Its trailing P/E is only 12x. If earnings fall to $5 as the cycle weakens, the same $120 share price represents 24x forward earnings.
The apparent bargain disappears without the stock price moving at all. Energy, materials, semiconductors and other cyclical businesses deserve particular caution when profits are near a cycle peak.
Heavy debt, shrinking margins or declining revenue can create the same problem. A low P/E does not compensate automatically for weakening fundamentals.
A premium multiple can make sense when earnings growth is rapid and durable. Paying 30x earnings for a business increasing profits by 25% a year presents a very different valuation from paying 30x for growth of 5%.
Higher multiples leave less room for disappointment because more future success is already reflected in the price. Slower growth, weaker margins or lower earnings forecasts can therefore produce much larger valuation adjustments.
The PEG ratio can add growth context, but a PEG near 1 is not proof of fair value. Its usefulness depends on the earnings-growth forecast and it does not capture factors such as debt, cash-flow quality or earnings durability.
If it is a forward P/E, 20x is close to the S&P 500’s latest forward multiple. Whether it is attractive still depends on earnings growth, sector valuations and business quality.
A 30x forward P/E is well above the S&P 500’s latest forward multiple. Faster earnings growth can justify that premium, while slower growth makes it harder to defend.
No. A low multiple can reflect falling earnings, high debt, weak growth or temporarily elevated cyclical profits. Cheap-looking earnings can disappear faster than the share price adjusts.
A negative P/E means the company is losing money. Many financial platforms display the ratio as N/A because a negative earnings multiple has little practical valuation meaning.
A P/E becomes useful when it reveals how much future performance the share price already demands. The best comparison uses the same earnings basis across the company, its peers and the market.
P/E tells you how much the market is paying for each dollar of earnings. The real question is whether the business can earn enough to justify that multiple.
Disclaimer: This material is for general information purposes only and is not intended as (and should not be considered to be) financial, investment or other advice on which reliance should be placed. No opinion given in the material constitutes a recommendation by EBC or the author that any particular investment, security, transaction or investment strategy is suitable for any specific person.