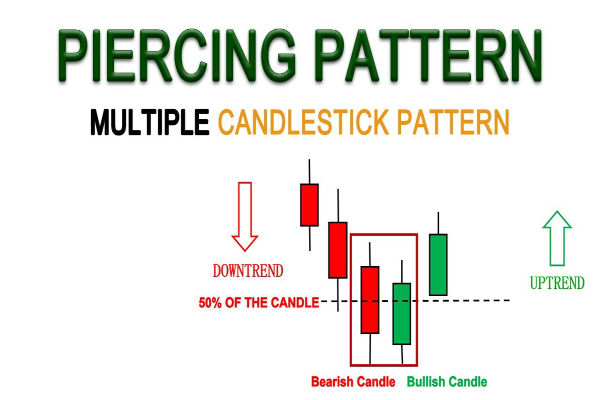
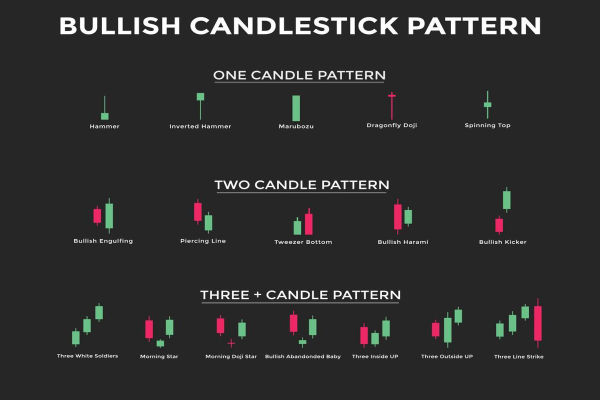
A bullish engulfing pattern is a common form of technical analysis in the
forex market and is widely used to predict the trend reversal of the
Prediction market. It usually appears in an upward trend formed by two
consecutive candle charts.

The first candle in the suspended form is a positive line, with a solid and
overhead line. It indicates that buyer power dominates the market and prices
rise. However, the second candle is a larger dark line, and its entity
completely surrounds the entity of the first candle. This pattern suggests that
the seller's power is increasing and may trigger a price drop.
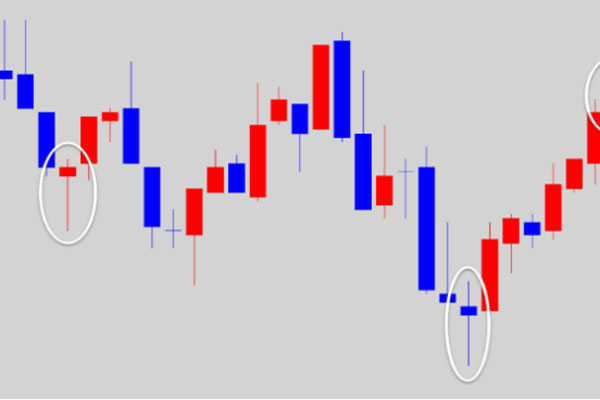
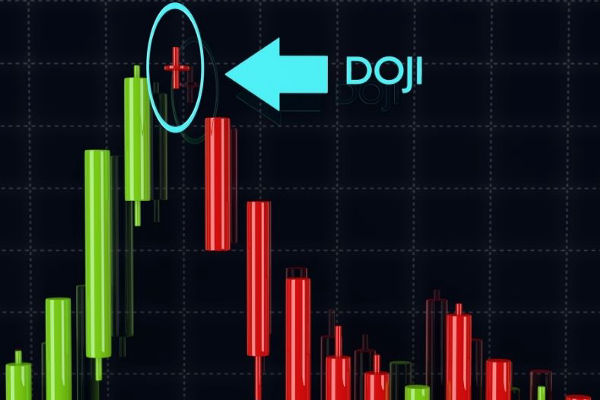
The hanging pattern is seen as a bear market signal, indicating that the
upward trend is about to end. It suggests a shift in market sentiment, as
investors may start selling currency pairs in the hope of a price decline and
profiting from it.
However, relying solely on an empty form cannot serve as an independent basis
for decision-making. Investors also need to combine other technical indicators
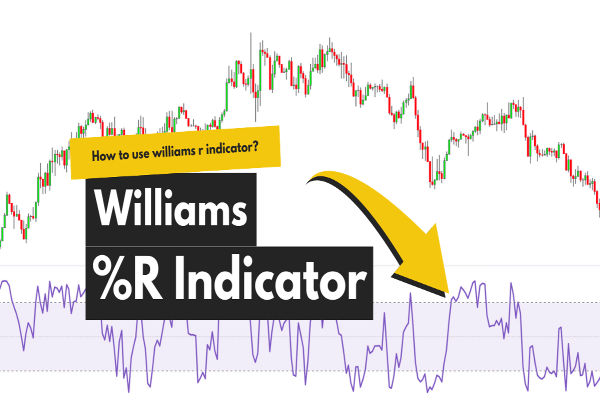
and analytical tools, such as moving averages and relative strength indicators(RSI),
to verify the effectiveness of the form. In addition, market risk and other
fundamental factors also need to be fully considered.
At the same time, the success rate of the suspended form also depends on the
context in which it appears. If the suspended form appears in a strong trend,
its predictive power will be more reliable. If it occurs during the
consolidation stage or other unclear market conditions, the effectiveness of the
suspended form may be lower.
In summary, the hanging short pattern in the forex market is an
important technical analysis tool. However, investors should carefully analyze
the background and market situation of the hanging short form when making
decisions, combine it with other indicators for comprehensive analysis, and pay
attention to the impact of market risks. Only after fully considering various
factors can we more accurately judge the reversal of trends and adopt
corresponding trading strategies.


