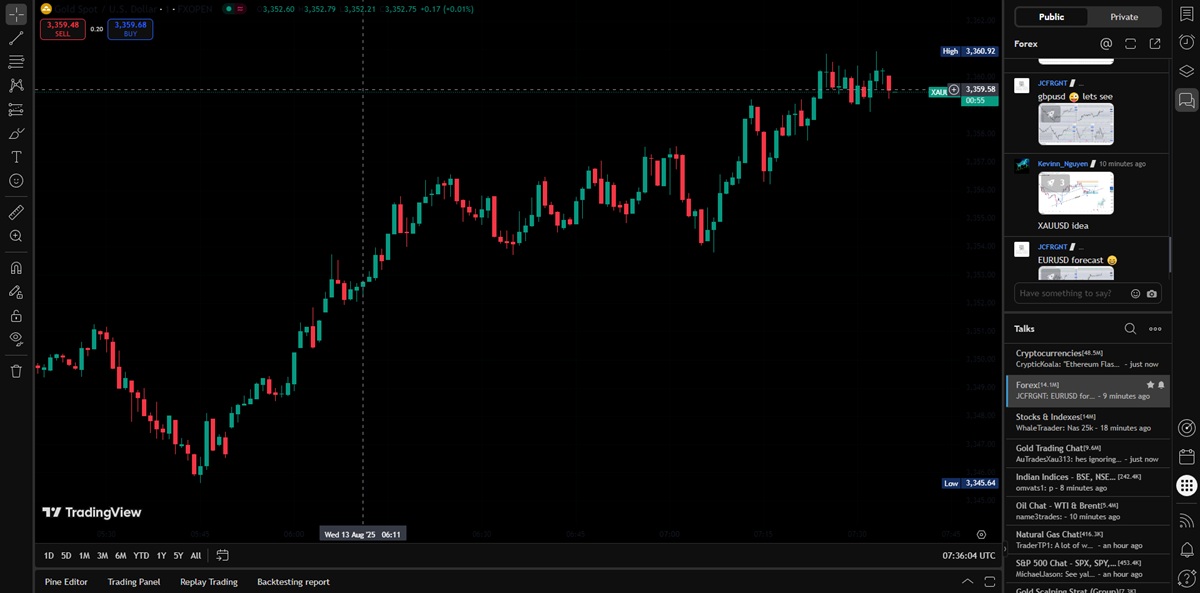
As one of the world's leading trading analysis platforms, Tradingview connects to hundreds of data sources, providing direct access to over 2.019.615 instruments worldwide. Through its institutional-level data partners, traders can obtain the forward-looking information used by professional investors. Today, we will give a brief introduction to the TradingView interface.
Basics of TradingView Interface
This is the standard TradingView layout. On the far left, you will find a variety of tools, including drawing, measuring, and adding labels, all of which can be accessed with a single click.
By hovering the mouse over the relevant panel, an option box will automatically appear. The most frequently used tools have dedicated shortcuts, which are also displayed next to the indicator. For instance, the shortcut for a horizontal line is Alt + H.
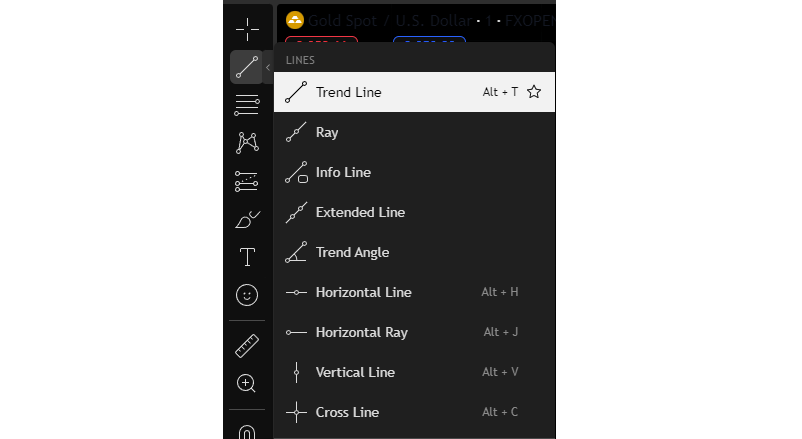
If you move the mouse to the far right of the option box, you can add items to your favorites for quicker access.

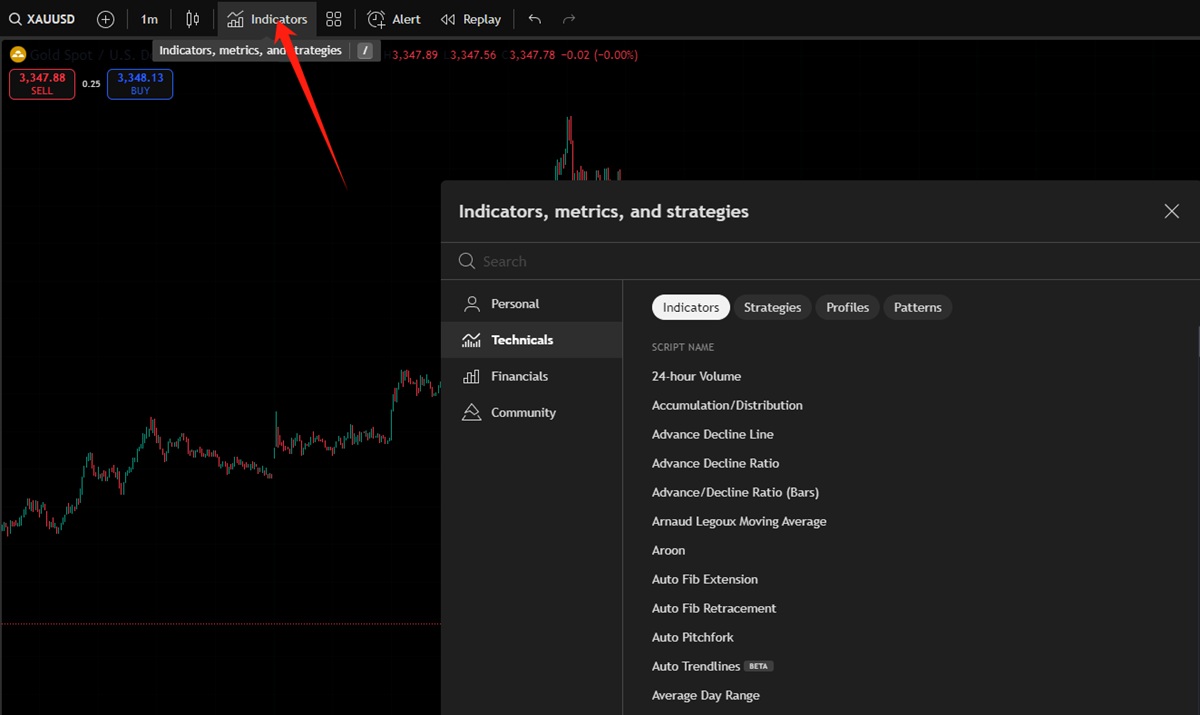
Additionally, by clicking the Indicators tab at the top, you can explore all available indicators within TradingView, enabling more advanced functions.
TradingView's Timeframes
In trading, switching between timeframes is inevitable.
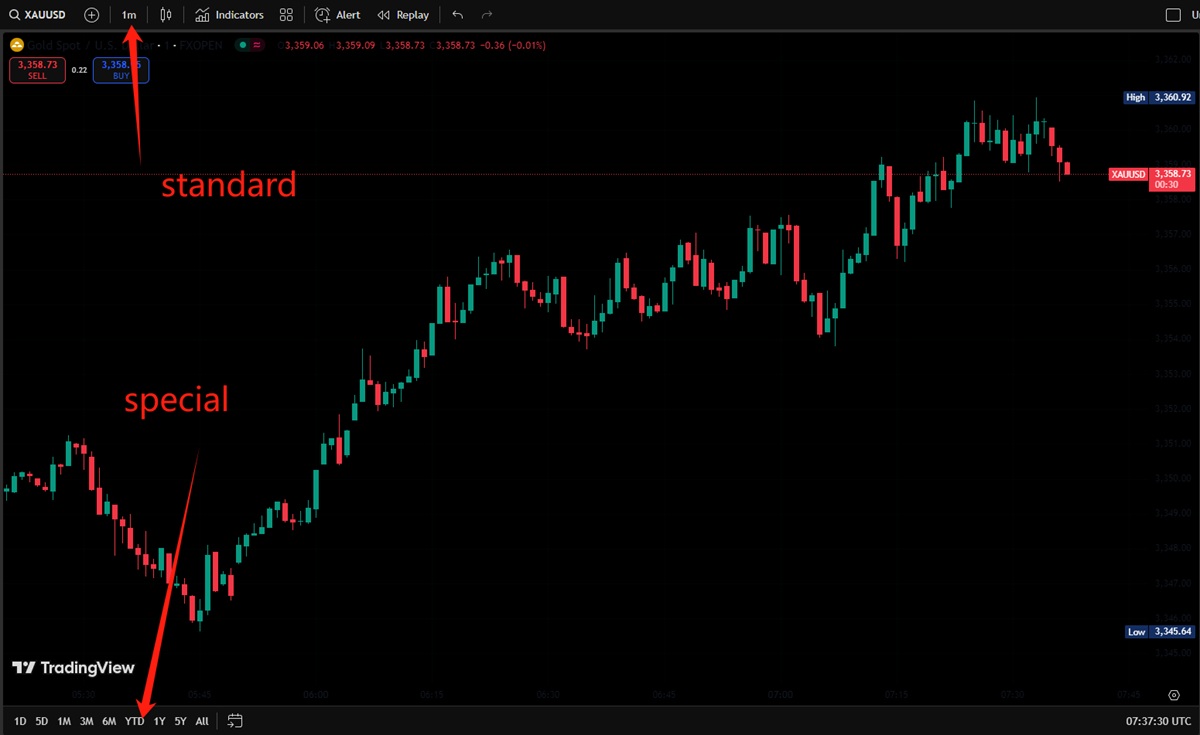
TradingView provides two types of timeframes.
At the very top are the standard timeframes, which can be switched with a single click. TradingView also offers tick-level data, where every market move is registered as a single tick. These are measured in milliseconds, allowing traders to observe the market's most detailed fluctuations.
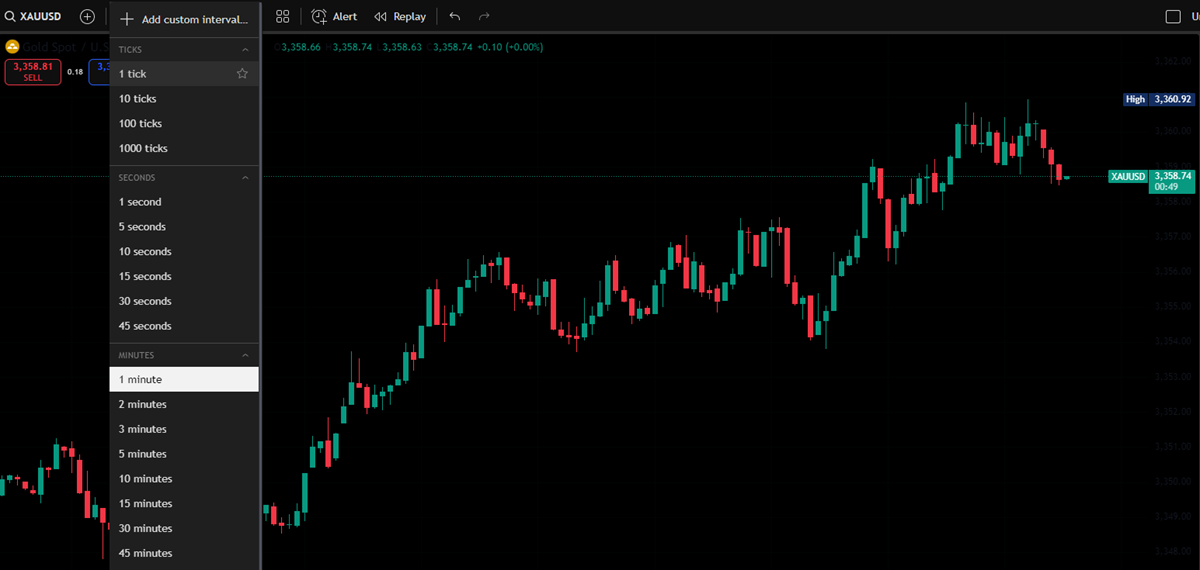
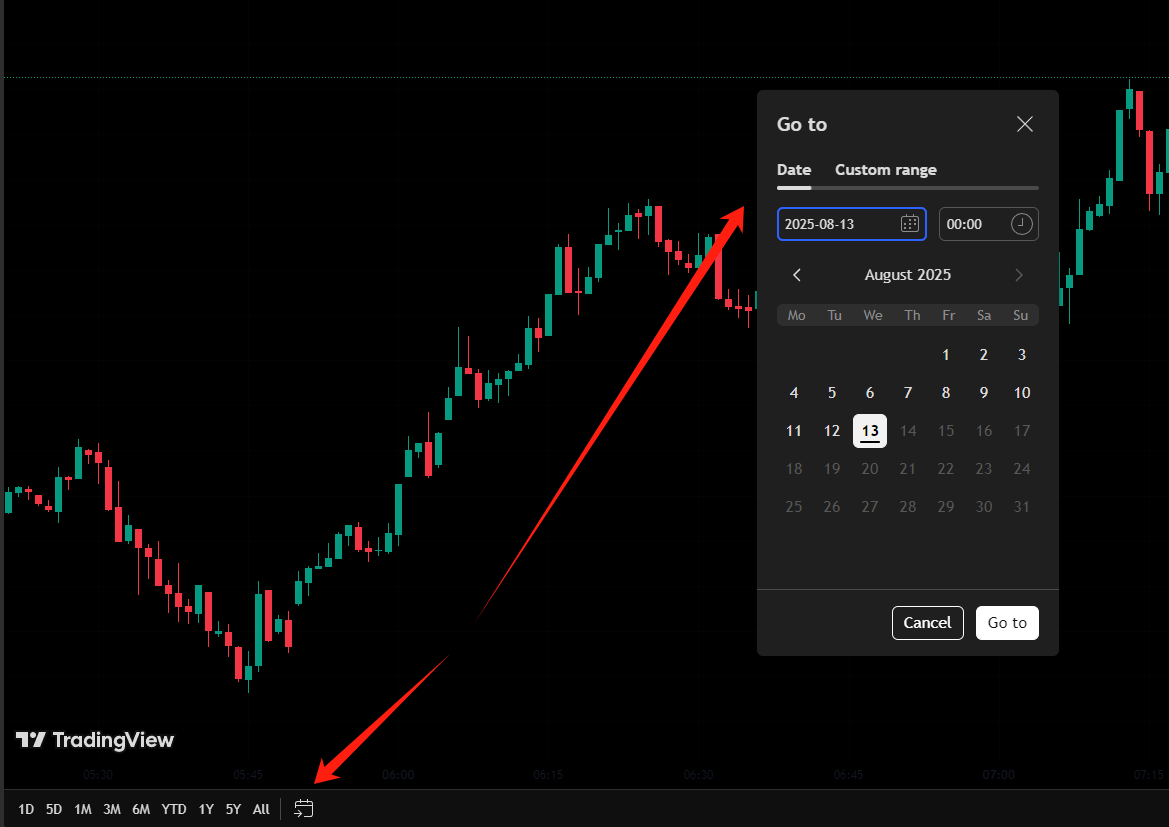
Below, you will find special timeframe options. These display market trends within a specific period, such as a 6-month trend using a 2-hour timeframe. On the far right of this selection box, you can also filter by date to focus directly on the period of interest.
Zooming and Chart Reset
To zoom in or out in TradingView, you can simply scroll up or down with the mouse wheel.
Many TradingView features are also accessed via the right mouse button. Right-clicking on any blank area of the chart will bring up an option box.
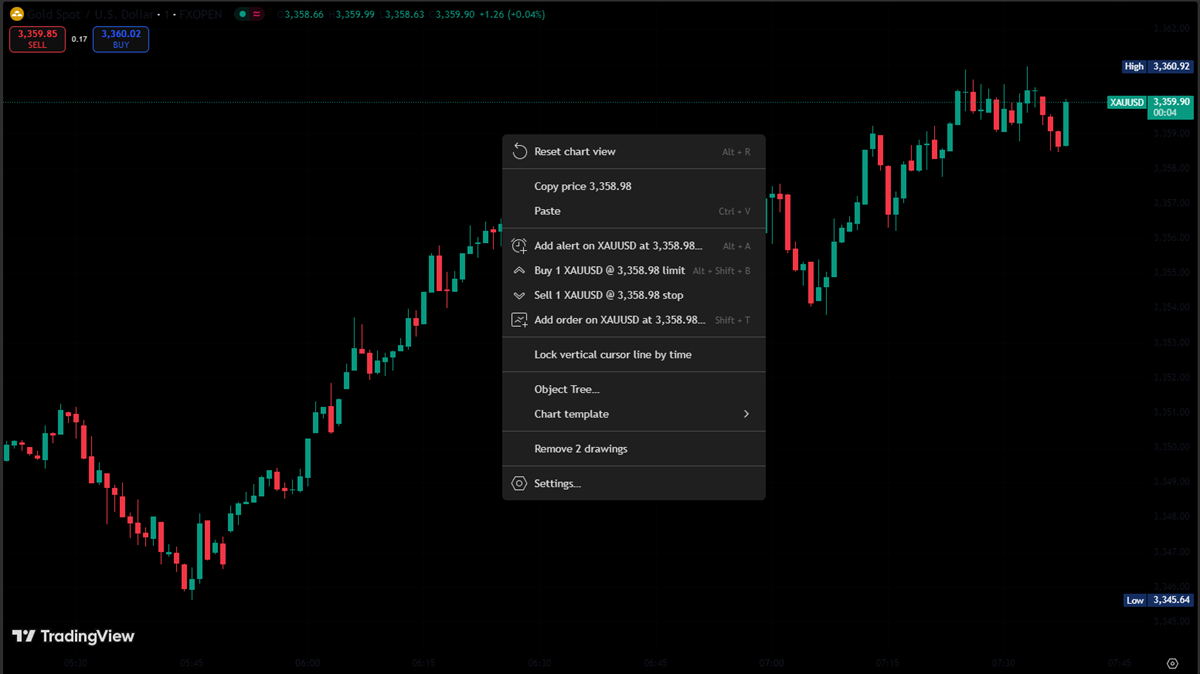
Resetting the chart will return the display to the default zoom level while retaining any previously drawn lines.
The Paste function allows you to insert images or text. A practical use of this feature is to paste reminders such as trading rules, events, or charts directly onto your screen.
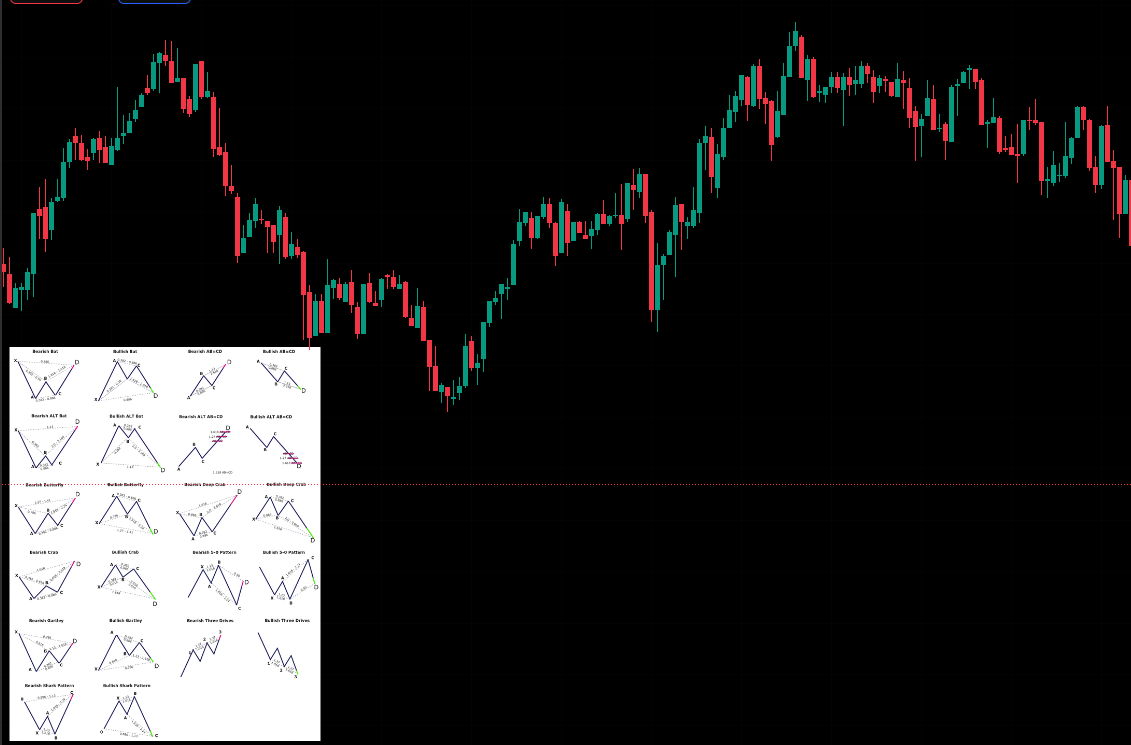
On this page, you can also perform a range of actions such as placing limit sell orders, stop-buy orders at the current price, and setting alerts.

The Remove Drawings option clears all drawings, annotations, or pasted images in one click.
This covers the most basic functions of the TradingView interface. The more you practise and adapt, the better your trading decisions will become. In the next session, we will introduce some of the platform's advanced features.
Disclaimer: This material is for general information purposes only and is not intended as (and should not be considered to be) financial, investment or other advice on which reliance should be placed. No opinion given in the material constitutes a recommendation by EBC or the author that any particular investment, security, transaction or investment strategy is suitable for any specific person.


