Published on: 2025-08-07
In today's fast-paced forex markets, traders face a barrage of conflicting signals and data. Success comes from filtering out distractions and focusing on methods that deliver consistent results. This article outlines how to build a clear forex trading strategy using core technical analysis and forex indicators, then shows how EBC Financial Group's real offerings—market analysis reports, expert webinars, and customisable signal alerts—can sharpen your edge.

Forex markets move on thousands of factors each day, from economic statistics to political headlines. This “noise” often leads traders to overreact, chase false signals, and suffer losses. A robust forex trading strategy cuts through these distractions by relying on straightforward technical analysis and a select set of forex indicators. This approach reduces confusion, boosts confidence, and helps traders focus on high-probability setups.
Before exploring EBC's services, let's review essential forex indicators every trader should understand:
1. Moving Averages (MA)
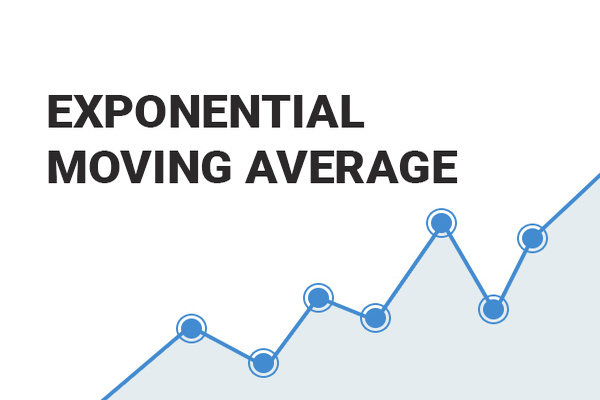
Moving averages smooth price data over a chosen period, making trends easier to spot. Common types include:
Simple Moving Average (SMA): Calculates the average price over a set number of periods.
Exponential Moving Average (EMA): Places more weight on recent prices, reacting faster to market shifts.
Traders watch for crossovers (for example, when the 50-period SMA crosses the 200-period SMA) to signal new trends.
2. Relative Strength Index (RSI)
RSI measures momentum on a scale of 0 to 100, highlighting overbought and oversold conditions.
Readings above 70 suggest overbought markets, hinting at possible reversal or pullback.
Readings below 30 indicate oversold markets, signalling potential buying opportunities.
Combining RSI with price action strengthens entry and exit decisions.
3. Bollinger Bands
Bollinger Bands consist of a middle SMA and upper/lower bands set at a standard deviation above and below that average.
Bands narrow during low volatility and widen when volatility spikes.
Price touching the bands often precedes reversals or continuation moves.
This indicator helps traders gauge market volatility and avoid noisy ranges.
4. MACD (Moving Average Convergence Divergence)
MACD shows the relationship between two EMAs, typically 12- and 26-period.
The MACD line crossing above the signal line flags bullish momentum.
Crossing below signals bearish momentum.
Divergences between MACD and price can foreshadow trend changes.
By mastering these forex indicators, traders establish a reliable technical analysis framework.

While mastering indicators forms the backbone of any forex trading strategy, combining these with expert insights and real-time alerts can elevate your performance. EBC Financial Group offers three key services designed to help traders cut noise and trade what works:
1. Daily and Weekly Market Analysis Reports
EBC's in-house analysts publish comprehensive reports each day and week, covering major currency pairs and market shifts. These reports include:
Clear trend summaries based on technical analysis.
Key support and resistance levels are identified with moving averages and Bollinger Bands.
RSI and MACD readings highlight overbought or oversold conditions.
Economic event calendars with forecasts and impact assessments.
By reading these concise reports, traders save time filtering through data. They can trust EBC's expert view and align their forex trading strategy accordingly.
2. Live Webinars and On-Demand Tutorials
EBC hosts regular webinars led by veteran traders and analysts. Topics range from beginner tutorials on price action to advanced sessions on deploying multiple forex indicators in a single strategy. Benefits include:
Interactive Q&A to clarify technical analysis concepts.
Step-by-step demonstrations of trading strategies in live markets.
Recordings are available on demand for review.
These educational resources help traders of all levels deepen their understanding, refine their approach, and avoid common pitfalls caused by market noise.
3. Customisable Signal Alerts
EBC's signal alerts service delivers real-time notifications by email or SMS when key technical conditions are met. Alerts are fully customisable, letting traders:
Receive notifications for moving average crossovers or RSI thresholds.
Track Bollinger Band squeezes or MACD divergences.
Set personalised risk parameters for each alert.
These hands-free alerts ensure traders don't miss critical setups and can focus on executing trades rather than monitoring multiple charts.
As a serious trader, you're ready to act on precise, actionable insights. Here's how to combine core forex indicators with EBC's offerings to form a complete strategy:
Review EBC Market Reports: Start each trading day by reading the latest daily report. Note the highlighted trends, support and resistance levels, and key RSI and MACD signals.
Prepare Your Charts: Apply moving averages, Bollinger Bands, RSI, and MACD to your charting platform.
Join a Webinar: Attend an upcoming session or watch a relevant tutorial to reinforce your understanding of the technical analysis concepts you'll use.
Set Signal Alerts: Configure EBC's signal alerts for the currency pairs you plan to trade. Focus on your favourite indicators, such as a 50/200 SMA crossover or RSI entering oversold territory.
Execute with Discipline: When you receive an alert that aligns with your prepared chart and EBC's market report, enter the trade. Use stop-loss orders based on support or resistance levels and manage position size to limit risk.
Journal and Review: After trading, record your entries, exits, and results. Compare your performance against EBC's weekly report to identify areas for improvement.
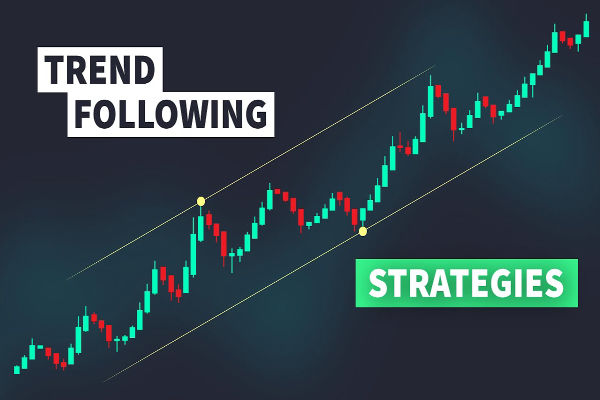
Imagine EBC's daily report notes a bullish trend in EUR/GBP, confirmed by the 50 EMA sitting above the 200 EMA. RSI on the four-hour chart dips to 35, signalling a mild oversold condition within the uptrend. You attend an on-demand tutorial on combining RSI with trend following and set a custom alert for RSI below 40.
When the alert arrives, you see a bullish engulfing candle at a key moving average support on your chart. You enter long, place the stop-loss below the recent swing low, and target the next resistance level marked in EBC's report. The trade yields a solid gain, validating the integrated approach.
Clarity: EBC's reports and webinars distil complex data into clear insights, reducing noise.
Precision: Custom signal alerts ensure you only trade when conditions match your strategy.
Consistency: Following a step-by-step plan minimises impulsive decisions and overtrading.
Education: Ongoing training through webinars keeps you up to date with the latest technical analysis techniques.
By blending core forex indicators with EBC's expert analysis and alert system, traders gain a strategic advantage in any market condition.
Visit EBC.com and choose the market analysis package and signal alert tier that suits your trading style.
Explore the educational centre to register for upcoming webinars or access tutorials.
Configure your alert preferences and link them to your preferred email or phone.
Follow the steps listed above to trade confidently and efficiently.
With EBC's support, you can cut market noise, apply precise technical analysis, and execute a proven forex trading strategy that delivers consistent results.
Disclaimer: This material is for general information purposes only and is not intended as (and should not be considered to be) financial, investment, or other advice on which reliance should be placed. No opinion given in the material constitutes a recommendation by EBC or the author that any particular investment, security, transaction, or investment strategy is suitable for any specific person.