Published on: 2026-07-30
Updated on: 2026-07-30
Someone may never have bought an Apple share and still have money linked to the company’s performance.
Apple sits inside funds that follow major parts of the United States stock market. These include exchange-traded funds (ETFs) such as SPY and QQQ, as well as pensions and managed portfolios that hold similar investments.
When Apple’s share price moves, part of that movement flows into these wider products. Its size gives it a larger weighting than most companies inside the indices and funds that hold it.
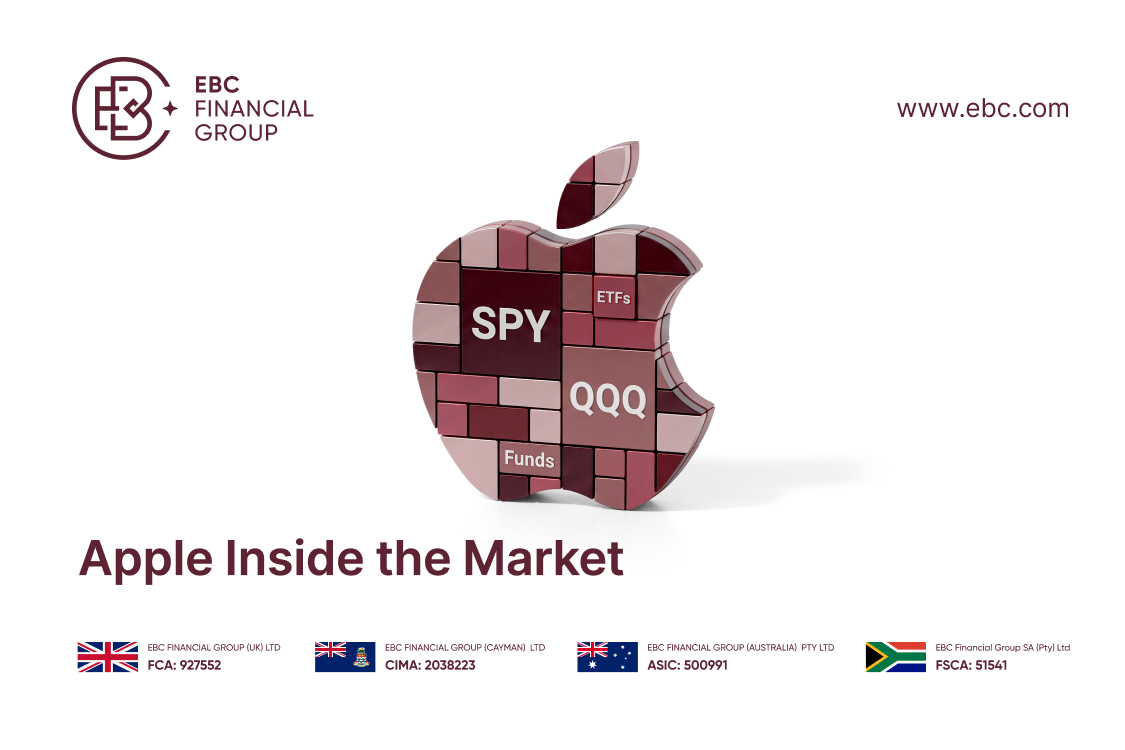
A person holding or trading an ETF such as SPY or QQQ may therefore be affected by an Apple earnings report even if they have never traded Apple itself.
It’ll be easier to understand once we look at how Apple is weighted inside major ETFs, what moves its share price, and how those movements reach the wider market.
Apple’s next earnings call on 30 July 2026 will also be Tim Cook’s final quarterly results call as chief executive before John Ternus takes over on 1 September 2026. This transition gives investors another reason to pay attention to Apple’s results and its outlook for the months ahead.
A stock index measures the performance of a selected group of companies. The S&P 500, for example, follows large US companies from across the economy.
An index is a measurement and cannot be bought directly. An ETF may track an index by holding shares in the companies included in it and trading on an exchange under its own ticker.
The companies inside an index or ETF do not always receive equal weight. Many major US indices use market capitalisation, which measures a company’s stock-market value. Larger companies usually receive larger weightings.
A stock representing 7% of a fund has more influence over its movement than one representing 0.1%.
SPY is an ETF that follows the S&P 500. The index covers large US companies from all 11 major market sectors, including technology, financial services, healthcare, energy, and industrials.
As of 23 July 2026, Apple represented 7.41% of SPY and was its second-largest holding after NVIDIA. The weighting changes as share prices and fund holdings change.
At that weighting, approximately USD7.41 of every USD100 in the fund was linked to Apple.
If Apple rose by 10% and all other SPY holdings were unchanged, its move would add approximately 0.74% to the fund’s value.
On a real trading day, gains and losses across the fund’s other holdings also affect the result. Apple may rise while other shares fall, or decline while gains elsewhere offset the loss. Its large weighting gives it influence without allowing it to determine SPY’s direction on its own.
Apple is also one of the largest holdings in QQQ. This ETF follows the Nasdaq-100, which includes 100 of the largest non-financial companies listed on the Nasdaq Stock Market. Apple was its second-largest holding in Invesco’s holdings data dated 15 July 2026.
SPY and QQQ both contain Apple, although they provide different types of exposure.
SPY covers companies from across the US economy. QQQ has a heavier concentration in large technology and growth companies, alongside businesses from several other industries.
Apple’s influence differs between the two funds because its weighting and the surrounding holdings are different.
Apple is a market heavyweight because its size gives it a large weighting in major indices and ETFs.
It is also described as a bellwether, which is a company investors watch for clues about a wider market, industry, or economy.
Apple’s results may provide information about:
Demand for premium phones, computers, and wearables
How frequently customers replace their devices
Spending on digital subscriptions and services
Consumer demand across major international markets
The outlook for suppliers and other technology companies
Apple’s supply chain reaches component manufacturers, chipmakers, assemblers, logistics providers, and retailers. Changes in its production plans or demand forecasts may affect expectations for companies connected to its products.
Apple’s results do not describe every part of the economy. Conditions affecting smartphones and digital services may have little connection to demand for bank loans, medicines, air travel, or energy.
Investors therefore compare Apple’s results with economic data and developments across other industries.
Apple’s share price reflects what investors expect the company to earn in the future. Product demand, services growth, profitability, and share buybacks all feed into that assessment.
Hardware remains central to Apple’s business. Sales of the iPhone, Mac, iPad, Apple Watch, AirPods, and other devices generate a large part of its revenue.
New releases may encourage customers to replace older devices. Investors look beyond the initial attention surrounding a launch and study whether people are buying the products, which models they choose, and whether demand continues after the first few weeks.
The timing of a launch may also shift revenue between quarters. An earlier release may make one quarter look stronger and the next weaker without changing total demand over a longer period.
Investors estimate demand before a product reaches stores, so the share price may move before the launch. The later reaction depends on whether sales meet those expectations.
Apple continues earning money from many customers after they buy a device. Its services include the App Store, iCloud, Apple Music, Apple TV, advertising, payments, and warranties.
Many of these services generate repeat payments. This gives Apple a source of revenue that is less dependent on customers replacing their phones or computers.
Investors watch whether services revenue is growing and whether customers continue paying over time. Changes to app-store or payment rules may affect how much Apple earns from this business.
Growth in sales does not always produce the same growth in profit. Apple pays for components, manufacturing, transport, employees, research, marketing, and retail operations.
Higher costs reduce the amount of profit Apple keeps from each sale. The mix of products sold also affects profitability because hardware and services carry different profit margins.
Currency movements add another factor. Apple earns revenue in several currencies but reports its results in US dollars. A stronger dollar may reduce the reported value of overseas sales when that revenue is converted back into dollars.
Apple also uses some of its cash to repurchase its own shares.
A buyback reduces the number of shares in circulation as the company completes those purchases. When the same amount of profit is divided among fewer shares, earnings per share may rise.
Suppose a company earns USD100 and has 100 shares. Its earnings equal USD1 per share. If the share count falls to 90 while total profit remains USD100, earnings rise to about USD1.11 per share.
Each remaining share then represents a larger portion of the company’s earnings. The effect on the share price still depends on business performance, the price paid for the shares, and what investors had expected before the announcement.
Continue reading to see how these factors came together for Apple’s results in May 2024.
Apple reported fiscal second-quarter revenue of USD90.8 billion in May 2024, down 4% from the previous year.
Other parts of the report were stronger:
Services revenue reached a record.
Earnings per share set a March-quarter record.
Apple authorised an additional USD110 billion for share repurchases.
The results and sales outlook were stronger than analysts had expected.
Apple shares jumped nearly 6% before the market opened the following day. Investors responded to the better-than-feared results, the prospect of sales growth returning, and the record buyback programme.
Investors looked beyond the revenue decline to the services figures, earnings per share, buyback, and outlook for the next quarter.
The move in Apple also fed into funds holding the company. A fund’s reaction still depended on whether gains in Apple were reinforced or offset by its other holdings.
Someone seeking exposure to Apple may encounter the company in several forms.
Buying Apple shares gives an investor direct exposure to the company’s performance. The value rises or falls with the share price, while shareholder rights depend on how the shares are held.
An ETF such as SPY or QQQ spreads exposure across Apple and many other companies.
The amount linked to Apple depends on its weighting. SPY offers broader exposure across the US market, while QQQ places greater weight on large companies listed on Nasdaq.
Holding several companies reduces dependence on Apple alone, although it does not remove the risk of loss. Several large holdings may rise or fall together.
A contract for difference (CFD) allows a trader to take a position on Apple’s share-price movement without owning the underlying share.
A trader may open a long position when expecting the price to rise or a short position when expecting it to fall. The result depends on the difference between the opening and closing prices.
CFDs use leverage, so a smaller deposit controls a larger market position. This increases the size of possible gains and losses. CFD traders also do not receive the same ownership rights as Apple shareholders.
Before placing a trade, a person should understand the full position size, margin requirement, spread, trading costs, and possible loss.
EBC is currently offering zero commission and zero overnight swaps on eligible US stock CFDs until 11 September 2026, subject to the official campaign terms and regional availability.
Commission is normally charged when an eligible CFD position is opened or closed. An overnight swap fee applies when a leveraged position remains open overnight.
These charges depend on how the position is opened and held, not whether the trade ultimately makes a profit. They may reduce a gain or add to a loss.
During the campaign, eligible traders avoid both charges on qualifying US stock CFDs. The longer a position remains open overnight, the more overnight swap charges may accumulate under standard pricing.
The example below uses a long Apple CFD position of 10 shares at USD100 per share. The position is opened on 28 July, held for two nights, and closed on 30 July.
|
TRADING COST |
STANDARD PRICING |
CAMPAIGN PRICING |
| Commission to open | USD0.20 | USD0 |
| Overnight swap fee for 2 nights | USD0.33 | USD0 |
| Commission to close | USD0.20 | USD0 |
|
TOTAL TRADING COST |
USD0.73 | USD0 |
The table shows how commission and overnight swaps may reduce the result of a trade before accounting for the movement in Apple’s share price.
The campaign removes commission and overnight swaps, but the spread still applies. The spread is the difference between the price at which a position can be opened and the price at which it can immediately be closed. Because of this difference, a new CFD position usually begins at a small unrealised loss.
With commission and overnight swaps removed, the position has fewer trading costs to recover before it can produce a net gain. The market must still move far enough in the trader’s favour to cover the spread, and a profitable result is not guaranteed.
The risk of loss also remains. CFDs use leverage, so losses may increase quickly when Apple’s share price moves against a position.
This example is for illustration only. It excludes the spread and any gains or losses caused by market movement. Actual charges may vary according to the position direction, trade size, holding dates, account conditions, and applicable rates.
When Apple moves sharply, traders may look at what caused the move, how much weight it carries in the fund being followed, and whether other large holdings are moving in the same direction.
Together, those details show whether the news is affecting Apple alone or reaching further across the US market.
See how to trade US stocks and ETFs with zero commission and swap fees.