Published on: 2026-02-12
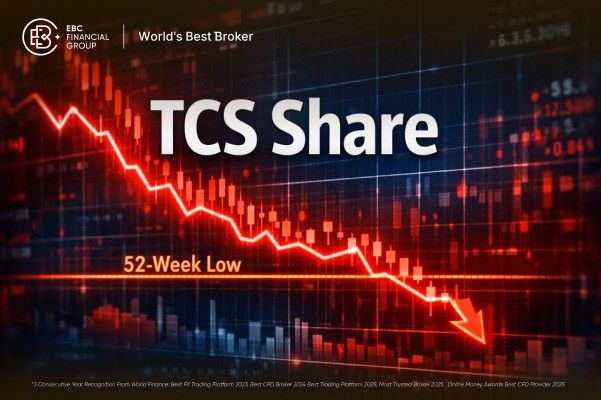
TCS share price slid to a fresh 52-week low on February 12, 2026, pulling the stock into a price zone that forces investors and traders to ask the same question at the same time: "Is this a bargain, or is this the market warning me that the story has changed?"

On February 12, 2026, TCS shares fell to a 52-week low, trading as low as ₹2,753 and fluctuating between approximately ₹2,753 and ₹2,780 throughout the session. The day's trading range was broad, with buyers attempting to support the lows while sellers continued to push against any rallies.
A mix of macro nerves, sector fear around AI-driven productivity, and a technical breakdown that has flipped dips into selling opportunities is driving this drop.
The stock is also reacting to a reality traders don't like: earnings can look "okay" on revenue, but if profit momentum weakens or costs jump, the market will still punish the price.
Price: around ₹2,757
Intraday low: about ₹2,753
52-week range: ₹2,753 to ₹3,984
Today's range: ₹2,753 to ₹2,880
That puts TCS almost at the absolute bottom of its past year's range.
Based on today's price, the stock is only about 0.3% above its 52-week low, which is as close to "range-bottom trading" as it gets without breaking new lows.
Additionally, the TCS share price is now about 31% below its 52-week high. And because maths is cruel, it would take roughly a 45% rally from here to get back to that peak.

A key part of this sell-off is sentiment. Investors are questioning whether AI reduces the amount of work that can be billed in traditional service models. Even if AI creates new demand, the market's first reaction is usually to discount the old demand first, then ask questions later.
That fear flared up again this week after news about new AI productivity tools triggered a broader sell-off across Indian IT names. TCS was negatively impacted because it is a core holding in many portfolios. When investors reduce their sector exposure, TCS is often the first to be sold due to its liquidity.
Key Investor Takeaway:
This is less about one company's quarterly numbers and more about a pricing reset on the sector's long-term unit economics. When the market starts debating "how many people are needed to deliver the same outcome," it also starts debating what a fair valuation multiple should be.
Another piece that matters is global rates. When US data comes in strong, traders tend to push out expectations for rate cuts. That typically lifts yields and hurts rate-sensitive parts of the equity market, including tech and IT services.
Even if TCS earns in multiple currencies and has a defensive reputation, the stock still trades like a long-duration cash-flow asset in risk-off moments. So the macro tape can overpower company-specific positives for days or even weeks.
TCS reported Q3 FY26 numbers with:
Revenue: $7,509 million
Operating margin: 25.2%
Net income: $1,503 million
Total contract value (TCV): $9.3 billion
Dividend: ₹57 per share (including a special dividend)
That looks fine at a headline level. But profit also faced pressure year-on-year due to cost impacts and restructuring-related items noted across multiple reports around the results.
Why This Is Important:
When the mood in the sector is uncertain, the market becomes selective. It stops paying up for "stable," and starts asking, "Stable compared to what, and for how long?"
Once a stock breaks key averages and previous lows, it tends to attract systematic selling and risk reduction. The chart is now doing part of the narrative work.
On February 12, the technical dashboard showed a broad "Strong Sell" setup across moving averages and indicators, with momentum readings deep into oversold territory.
| Indicator | Value | What it implies |
|---|---|---|
| RSI (14) | 12.552 | Oversold, selling stretched |
| MACD (12,26) | -53.87 | Downtrend momentum still strong |
| ADX (14) | 57.541 | Trend is strong (bearish control) |
| Stoch (9,6) | 26.601 | Weak momentum |
| Williams %R | -97.778 | Deep oversold |
| CCI (14) | -163.0004 | Strong downside pressure |
| ATR (14) | 24.7 | Higher day-to-day swing risk |
Technically, TCS is in a sharp downtrend and deeply stretched.
The cleanest signal is RSI. The daily RSI(14) is around 12.6, which is extreme oversold territory. That doesn't guarantee a rebound tomorrow. It does tell you that the selling has been aggressive and one-sided.
At the same time, trend strength has not faded. ADX(14) is above 57, which signals a strong trend (right now, that trend is down).
An RSI near 12 is rare. It usually leads to one of two paths:
Fast bounce, then another sell
Short covering pushes the price up, but the first rebound often fails near MA5 or MA10. That's where sellers test demand.
Dead-cat bounce, then base building
Price stops falling, volume calms, and you get a messy sideways range. That's often healthier than a sharp V-shape because it lets the supply be clear.
With ADX high, the downtrend remains strong, so the "bounce then sell" path is more common unless the broader market tone improves.
| Moving Average | Simple (SMA) | Exponential (EMA) | Signal |
|---|---|---|---|
| MA5 | 2810.12 | 2809.74 | Sell |
| MA10 | 2875.84 | 2855.26 | Sell |
| MA20 | 2925.62 | 2898.02 | Sell |
| MA50 | 2975.50 | 2967.84 | Sell |
| MA100 | 3067.24 | 3036.61 | Sell |
| MA200 | 3134.42 | 3097.97 | Sell |
All key moving averages are above the price. That's the definition of a downtrend.
TCS's share price is approximately 12% below the 200-day moving average and about 7% below the 50-day moving average, so any potential rebounds may encounter selling pressure in those overhead supply zones.
₹2,753 is the fresh 52-week low.
The classic pivot point for S3 is approximately ₹2,747.60, which is just below the recent low.
If this area breaks cleanly and the stock can't reclaim it quickly, traders often treat it as a "trap door" level.
MA5 is near ₹2,810, which often acts like a magnet after a sharp drop.
The upper range area around ₹2,880 is also a spot where failed bounces can roll over.
MA10 ~ ₹2,875 and MA20 ~ ₹2,926 are key levels where rallies often stall unless sentiment improves.
MA50 ~ ₹2,975
MA200 ~ ₹3,134
For swing traders, the 200-day is the line that changes how funds behave. Until the price starts holding above it again, the market will continue to treat rallies with suspicion.
TCS has reached a new 52-week low as investors sell off Indian IT stocks amid renewed concerns about AI disruptions and a macroeconomic shift that has delayed expectations of interest rate cuts. This combination has hurt both sector sentiment and valuation multiples.
Yes. The daily RSI (14) was around 12.55, which is an extreme oversold reading.
Revenue rose to ₹67,087 crore, while net profit came in at ₹10,657 crore, down about 14% YoY.
Support is near ₹2,753, with the next reference around ₹2,748 (classic S3). Resistance levels are around ₹2,810, followed by ₹2,875 and ₹2,926 (which correspond to the 10-day and 20-day moving averages).
In conclusion, the TCS share price hitting a 52-week low suggests the market is anxious and that investors are adopting a defensive stance. The stock is oversold, but the downtrend remains strong, so traders should be mindful of the risk of sharp whipsaws.
The clean roadmap is simple: hold the ₹2,753 to ₹2,750 zone and reclaim moving averages step by step for a more durable rebound. If the price loses that base and cannot recover quickly, the market usually looks for the next area where real buyers are willing to show up.
Disclaimer: This material is for general information purposes only and is not intended as (and should not be considered to be) financial, investment or other advice on which reliance should be placed. No opinion given in the material constitutes a recommendation by EBC or the author that any particular investment, security, transaction or investment strategy is suitable for any specific person.