Published on: 2023-11-03
Updated on: 2026-05-08
Profitability indicators show whether a company can turn sales into durable earnings, not just temporary growth. For investors, that distinction matters. A business can report rising revenue and still destroy value if costs rise faster, assets sit idle, or capital spending fails to earn an acceptable return.
This is why profitability indicators deserve more attention in 2025–2026. Corporate margins remain historically high, valuations are demanding, and companies are spending heavily on technology, automation, and artificial intelligence. The S&P 500 blended net profit margin reached 14.7% in Q1 2026, above 12.8% a year earlier and above the five-year average of 12.3%. That makes profit quality a central test for stock selection.
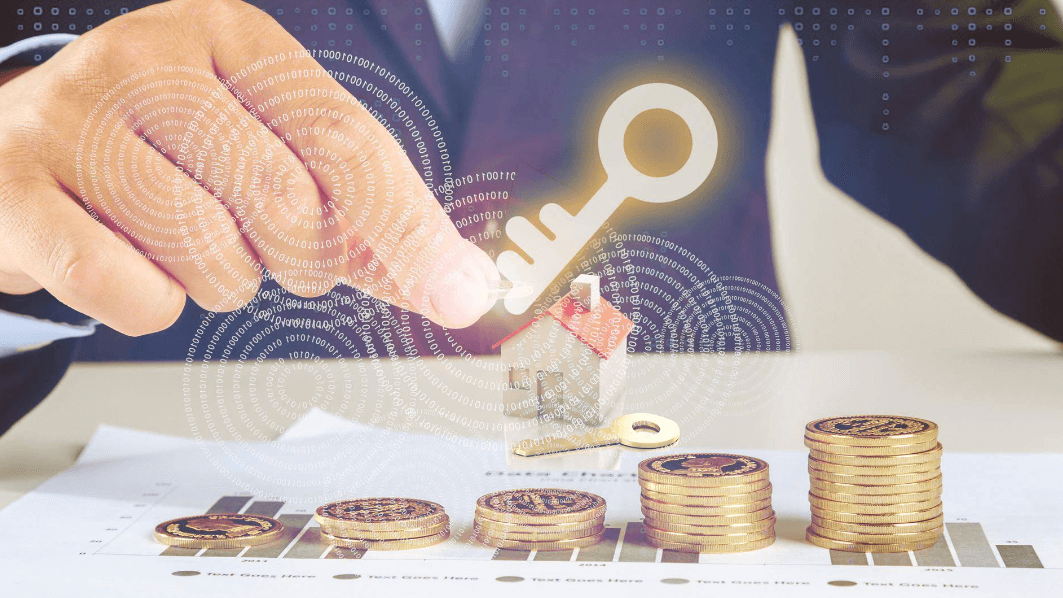
Profitability indicators measure how efficiently a company converts revenue, assets, equity, and invested capital into profit.
Margins reveal pricing power and cost control, while return ratios show whether management uses capital efficiently.
Strong profitability should always be compared with direct industry peers, as margins differ widely by sector.
ROIC and free cash flow margin are increasingly important as companies fund larger capital spending programmes.
Negative profitability is not always a warning sign, but repeated losses with weak cash flow usually signal deeper business risk.
Profitability indicators reflect the quality of a company’s business model. They show whether sales growth translates into real profit, whether assets generate sufficient income, and whether shareholders receive an attractive return on capital.
A company with strong profitability usually has one or more advantages. It may have pricing power, efficient production, strong brand loyalty, low distribution costs, or a scalable operating model. A company with weak profitability may face rising input costs, poor expense control, heavy debt, or limited competitive strength.
These indicators also help investors distinguish between growth and quality. Two companies may both increase revenue by 10%, but the better business is often the one that keeps more profit from each dollar of sales. That is why profitability indicators are often more useful than revenue growth alone.
They also measure resilience. In a slower economy, companies with stable margins and strong cash flow can continue investing, paying down debt, and returning capital to shareholders. Companies with thin margins have less room for error when demand weakens or financing costs rise.
There is no fixed number of profitability indicators. Different industries need different measures. A bank, a retailer, a software company, and a mining group do not earn profit in the same way. Still, most investors can start with a core set of ratios.
NAV is useful for funds, investment trusts, and some asset-heavy vehicles. It is not a standard operating profitability ratio for most companies. Net interest margin is essential for banks because lending income is their core business. For most listed companies, the most useful group includes gross margin, operating margin, net profit margin, ROE, ROA, ROIC, and free cash flow margin.
Margin indicators show how much profit a company keeps from revenue. Gross profit margin measures profit after direct production or service costs. Operating margin includes wider business expenses such as salaries, rent, marketing, and administration. Net profit margin shows what remains after all expenses, interest, taxes, and one-off items.
A rising gross margin may signal stronger pricing power or lower production costs. A falling operating margin may show that wages, logistics, marketing, or administration costs are rising too quickly. A stable net margin suggests the company can protect final earnings even when the operating environment changes.
Sector context matters. Information Technology reported a Q1 2026 net profit margin of 29.5%, while Energy reported 7.4%. The gap does not automatically make technology “better” and energy “worse.” It reflects different business models, capital intensity, commodity exposure, and cost structures.
Return indicators measure how effectively management uses capital. ROE shows the return generated on shareholder equity. ROA shows how well assets produce profit. ROIC shows whether the company earns enough on all long-term capital invested in the business.
ROIC is often the most important return indicator for long-term investors. A company that earns a ROIC above its cost of capital usually creates value. A company that earns below its cost of capital may grow revenue while still weakening shareholder returns.
This matters more as AI-related capital spending accelerates. Large hyperscalers are funding major infrastructure build-outs, and AI capex would need to reach $700 billion in 2026 to match the late-1990s telecom investment cycle as a share of GDP. Heavy investment is not automatically good. It must eventually produce stronger margins, cash flow, or ROIC.
Accounting profit does not always equal cash profit. A company can report positive net income while free cash flow weakens if inventory rises, receivables grow, or capital expenditures increase.
Free cash flow margin helps solve that problem. It shows how much cash remains after the company funds its operating needs and investments. This is especially useful for capital-heavy businesses, fast-growing companies, and firms with large technology spending plans.
Banks require a different lens. Net interest margin measures the spread between what banks earn on loans and securities and what they pay for deposits and other funding. In Q3 2025, FDIC-insured institutions reported ROA of 1.27% and aggregate net income of $79.3 billion, helped by stronger net interest income and lower provision expense.
Formulas are useful, but interpretation creates value. A high ratio is not always good, and a low ratio is not always bad. Investors need to know what is driving the number.
The most reliable signal is consistency. One strong year can come from a tax benefit, an asset sale, a cost-cutting cycle, or a temporary price increase. A stronger pattern emerges when profitability indicators improve over several periods while cash flow remains healthy.
Investors should also watch quality. A company can lift EPS through share buybacks even if net income barely grows. ROE can look impressive when debt is high and equity is low. Net margin can rise after aggressive cost cuts, but that may hurt future growth if research, service quality, or distribution capacity weakens.
Negative profitability indicators usually mean a company is losing money. The cause may be low revenue, high costs, heavy debt expense, weak demand, large investment spending, or poor operating execution.
Not every negative reading is equally serious. Early-stage companies often report losses as they build scale. Cyclical companies may lose money during downturns and recover when prices or demand improve. A company investing heavily in a new product may accept temporary margin pressure.
The warning sign is persistence. Repeated negative margins, weak cash flow, rising debt, and no clear path to breakeven usually point to structural problems. Investors should ask three questions: is the loss temporary, is cash flow improving, and does management have a credible plan to restore profitability?
A single bad quarter deserves analysis. A multi-year record of losses deserves caution.
Profitability indicators work best when used together. No single ratio gives the full picture. Net margin shows final profit, but it does not explain capital efficiency. ROE shows shareholder return, but it can be distorted by leverage. Free cash flow margin shows cash quality, but it may fluctuate when investment rises.
A practical approach is to compare four layers:
The company’s current profitability.
It's a five-year trend.
Its direct competitors.
The wider sector average.
This prevents misleading comparisons. A 6% net profit margin may be excellent for a supermarket but weak for a software company. A bank with a strong net interest margin still needs sound credit quality. A miner with strong margins may still face commodity price risk.
The best companies usually show several strengths at once: stable margins, rising ROIC, positive free cash flow, and manageable debt. When those signals appear together, profitability is more likely to be durable.
Profitability indicators are financial ratios that show how well a company turns revenue, assets, equity, or invested capital into profit. Common examples include gross profit margin, operating margin, net profit margin, ROE, ROA, ROIC, EPS, and free cash flow margin.
There is no single best profitability indicator. Net profit margin shows final earnings, ROE measures shareholder return, and ROIC shows capital efficiency. For long-term investors, ROIC and free cash flow margin are often the most useful because they show whether growth creates real value.
High profitability is positive only when it is sustainable. One-off gains, unusually low taxes, temporary cost cuts, or excessive leverage can make profitability look stronger than the underlying business. Investors should check the source of the improvement.
Revenue can rise while profitability falls when costs grow faster than sales. Higher wages, raw materials, logistics, marketing, debt interest, or capital spending can reduce margins even when customer demand remains strong.
Negative profitability means the company is losing money on the measure being reviewed. It may be temporary for young or cyclical businesses, but repeated losses, weak cash flow, and rising debt usually signal higher investment risk.
Profitability indicators help investors look past headline revenue and assess the quality of earnings. They show whether a business protects margins, uses capital efficiently, and converts accounting profit into cash.
In 2025–2026, these indicators are more important because companies face demanding valuations, heavy technology spending, and uneven sector margins. Investors who focus on margin quality, ROIC, free cash flow, and peer comparison can make clearer judgments about which businesses have durable profit power.
Disclaimer: This material is for general information purposes only and is not intended as (and should not be considered to be) financial, investment or other advice on which reliance should be placed. No opinion given in the material constitutes a recommendation by EBC or the author that any particular investment, security, transaction or investment strategy is suitable for any specific person.