The Nikkei 225, also known as indexNIKKEI: NI225, is Japan's most widely recognised stock market index and a crucial benchmark for gauging the performance of the Japanese economy.
Often compared to the Dow Jones Industrial Average, the Nikkei 225 reflects the movements of top publicly traded companies listed on the Tokyo Stock Exchange (TSE).
In this comprehensive guide, we'll break down what the Nikkei 225 is, how it operates, and why traders around the world keep an eye on this key Japanese index.
What Is the indexNIKKEI: NI225?
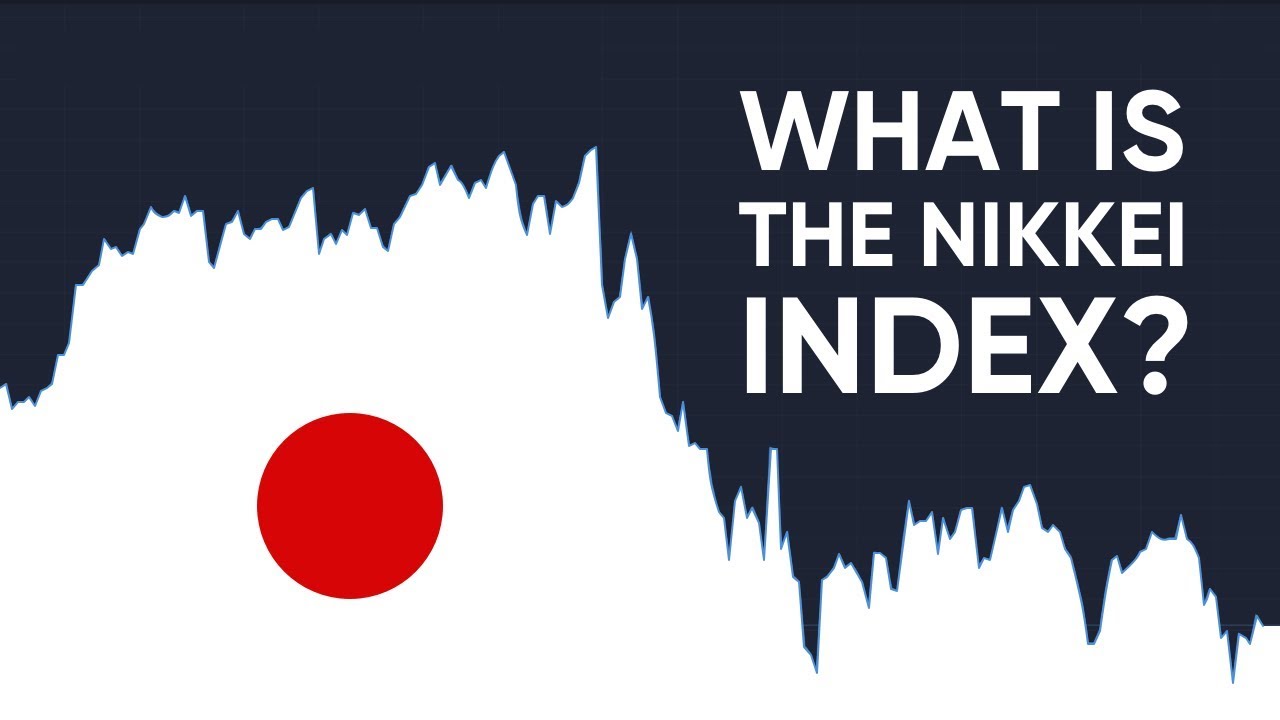
The indexNIKKEI: NI225 is a price-weighted stock index composed of 225 of the largest and most liquid companies listed on the Tokyo Stock Exchange (TSE). First calculated in 1950, the Nikkei was published by the Nihon Keizai Shimbun (Nikkei Inc.), one of Japan's largest financial newspapers.
Unlike market-cap-weighted indices like the S&P 500, the Nikkei 225 assigns a greater weight to higher-priced stocks, regardless of the company size. It can lead to discrepancies between a company's market value and its influence on the index.
The Nikkei 225 is widely regarded as the barometer of Japan's equity market and economic health. It includes companies from sectors such as technology, finance, manufacturing, retail, and pharmaceuticals.
Composition
The 225 companies in the index span 11 industry sectors, offering a cross-section of the Japanese economy. Here are some key sectors and notable constituents:
Technology: Sony, Tokyo Electron, SoftBank Group
Automotive: Toyota Motor, Honda Motor, Nissan
Retail and Consumer Goods: Fast Retailing (Uniqlo), Seven & I Holdings
Financials: Mitsubishi UFJ Financial, Mizuho Financial
Pharmaceuticals: Takeda Pharmaceutical, Astellas Pharma
The list of constituents is reviewed annually in October, with replacements made based on liquidity, industry representation, and sector balance. It ensures the index remains relevant and investable.
Nikkei 225 vs Other Major Indices
| Index |
Region |
Weighting Method |
No. of Companies |
Main Sector Influence |
| Nikkei 225 |
Japan |
Price-weighted |
225 |
Tech, Auto, Finance |
| S&P 500 |
United States |
Market-cap weighted |
500 |
Tech, Healthcare, Finance |
| Dow Jones |
United States |
Price-weighted |
30 |
Blue-Chip Industrials |
| FTSE 100 |
United Kingdom |
Market-cap weighted |
100 |
Energy, Banking |
| Hang Seng Index |
Hong Kong |
Market-cap weighted |
~50 |
Tech, Property, Finance |
indexNIKKEI: NI225 Brief History
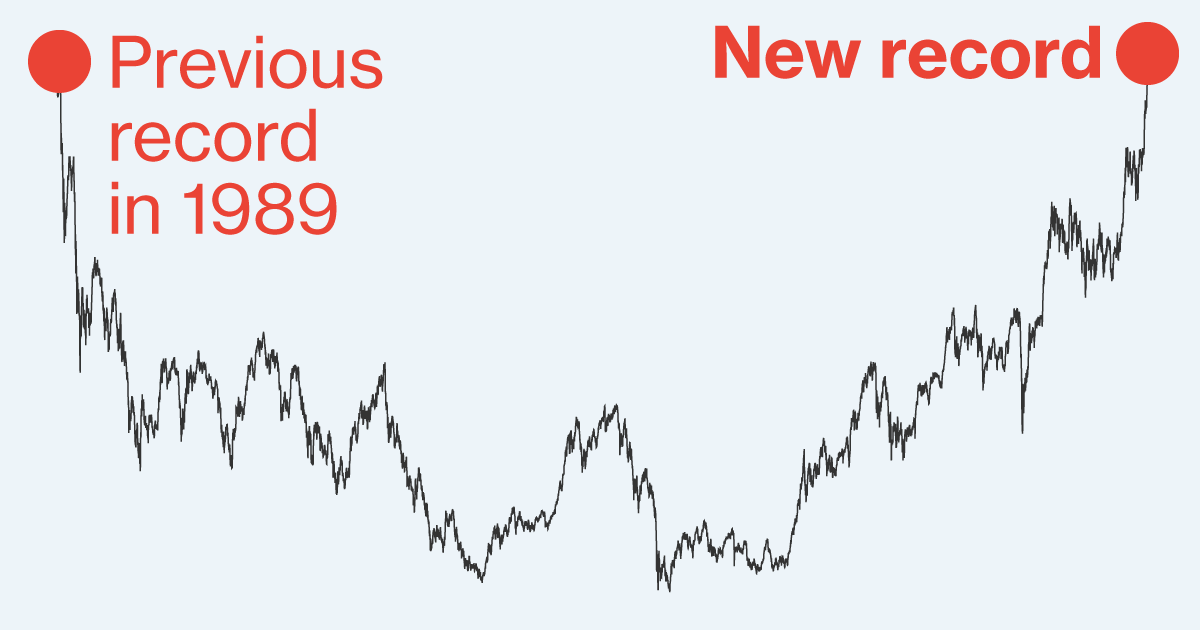
The Nikkei 225 has been tracking Japan's stock market for over 70 years. Its history mirrors the economic highs and lows Japan has experienced, from post-war recovery to the "Lost Decades."
1950: The index is first calculated, with data retroactively applied from 1949.
1980s: The Nikkei experienced unprecedented growth during Japan's asset bubble, reaching its all-time high of 38,957.44 on December 29, 1989.
1990s–2000s: Japan's economic slowdown leads to decades of stagnation. The index plummets and struggles to improve.
2010s–2020s: Globalisation and renewed investor interest in Asia bring more foreign capital to Japanese markets. The Nikkei begins a long-term uptrend.
Performance in 2025 So Far
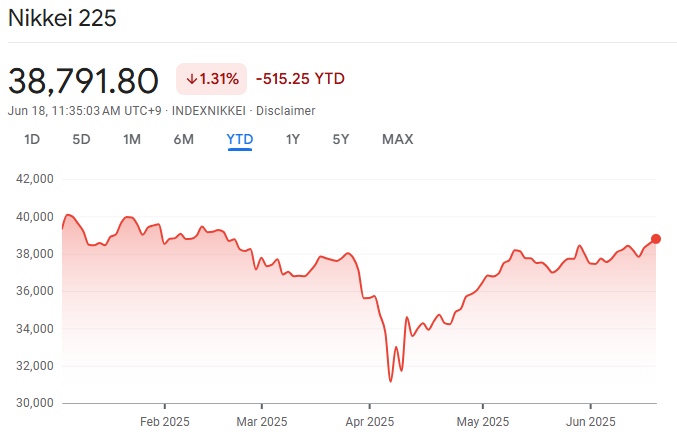
As of June 17, 2025, the Nikkei 225 closed at 38,791.80, marking a modest recovery from earlier declines this year. The index remains approximately 3% below its January levels and trails behind global peers such as the S&P 500 and Nasdaq, which have generated stronger year-to-date gains.
In mid-May, the index dropped to the range of 37,800 to 38,000, influenced by the strength of the yen and escalating trade tensions. However, domestic investor sentiment rebounded in June following a cautious move by the Bank of Japan to tighten monetary policy, combined with improving corporate earnings, leading the index back to 38,500+.
Despite this recovery, the Nikkei remains on track for a slight YTD loss of about 2.7–3.1% — the iShares Core Nikkei ETF shows a –3.08% return year-to-date.
Key Drivers
1. Yen Strength & Export Sensitivity
Mid-2025 saw a renewed appreciation in the Japanese yen, which eroded export-driven earnings and weighed on equity sentiment. With the BOJ raising interest rates, a steady but gradual yen rebound has reduced margins for exporters and lowered growth expectations.
2. Bank of Japan Policy Shift
In June, the BOJ surprised markets with the first hint of tightening after years of ultra-loose policy. While this bolstered bank and financial sector stocks, it also triggered caution due to the potential drag on economic stimulus.
3. Trade & Geopolitical Context
A Reuters poll predicts that the Nikkei is likely to increase by about 5% by the end of 2025. This growth is expected to be driven by reduced fears surrounding global trade policies, strong corporate earnings, and favourable interest rate trends.
However, volatility is a concern, especially regarding the potential reinstatement of tariffs and changing trade dynamics between the U.S. and Japan.
What Comes Next?
Analysts expect a rebound toward the 39,600–40,000 range by year's end. As near-term volatility recedes—particularly if trade tensions ease—the Nikkei could enter a cyclical recovery supported by:
Strong export performance amid stabilised yen value.
Continued gains from corporate earnings and structured governance reforms.
Gradual BOJ tightening that avoids stifling growth.
That said, geopolitical shocks, policy missteps, or sharp yen moves could pull the index back. The mid-to-high 38,000s will likely form a critical pivot range for direction over the summer.
How to Trade the indexNIKKEI: NI225
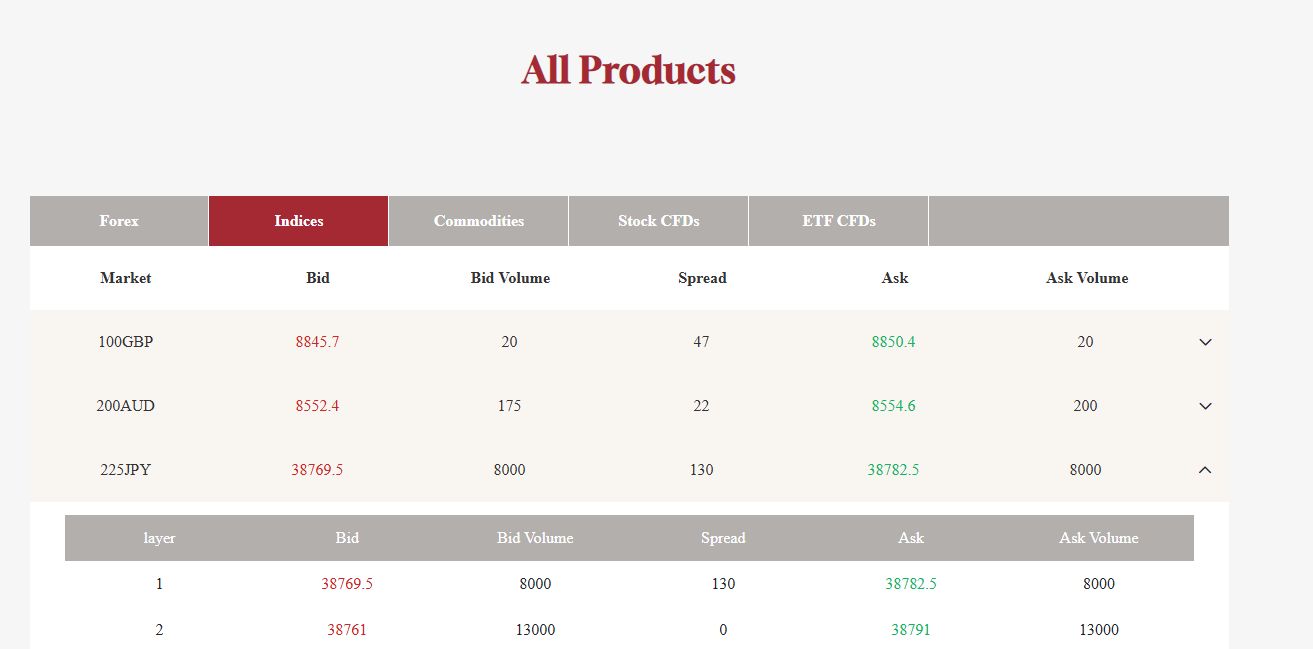
There are multiple ways for traders and investors to gain exposure to the index. The method you choose depends on your trading style, capital, and risk tolerance.
1. ETFs (Exchange-Traded Funds)
The most accessible way for retail investors to trade the Nikkei 225 is through ETFs tracking the index.
Popular options include:
iShares Nikkei 225 ETF
MAXIS Nikkei 225 ETF
Nomura Nikkei 225 ETF
With ETFs, global investors can trade the Nikkei 225 without trading the Tokyo Stock Exchange.
2. Nikkei Futures and Options
Active traders often use Nikkei 225 futures to speculate or hedge exposure. Futures and options offer leverage and flexibility, but they come with higher risks and are better suited for experienced traders.
3. CFDs (Contracts for Difference)
For traders outside Japan, CFDs on the Nikkei 225 are available through brokers like EBC Financial Group and others. CFDs allow traders to speculate on index movements without owning the underlying assets.
Key benefits of using CFDs:
However, CFDs carry the risk of leveraged losses and may not be suitable for all investors.
Trading Hours
The Nikkei 225 reflects the trading hours of the Tokyo Stock Exchange, which follows this schedule:
This means international traders, particularly those in Europe or the Americas, need to adjust their trading schedules accordingly. Many platforms also provide after-hours data or pre-market indicators, but these are often thinly traded and less liquid.
Conclusion
In conclusion, the indexNIKKEI: NI225 offers unique opportunities and challenges for traders seeking diversification, exposure to Asian markets, or short-term momentum plays.
Whether you choose to trade it via ETFs, CFDs, or futures, understanding how the index is structured, what influences its movement, and how to interpret its quotes is key.
Disclaimer: This material is for general information purposes only and is not intended as (and should not be considered to be) financial, investment or other advice on which reliance should be placed. No opinion given in the material constitutes a recommendation by EBC or the author that any particular investment, security, transaction or investment strategy is suitable for any specific person.
