Published on: 2025-07-22
Updated on: 2026-07-27
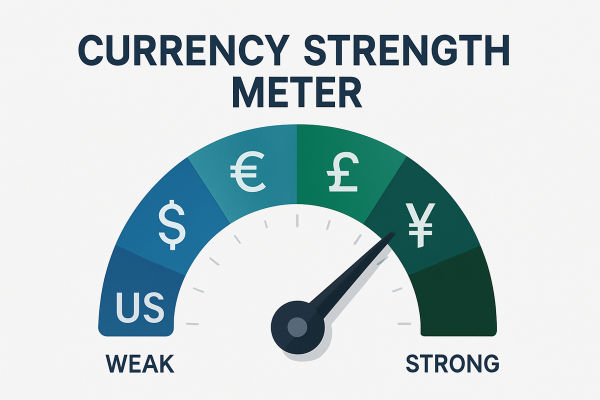
A currency strength meter gives each major currency a single score by averaging how far it has moved against the other majors over a chosen period. One glance replaces eight charts. The euro is either gaining ground across the board, or it is not, and the meter tells you which within a second.
The tool is built entirely from prices already on your chart. It reorganises information you can see, and it adds none. That makes it useful as a filter for narrowing a watchlist, and unreliable as a signal on its own.
Most meters use one method: the average percentage change of a currency across the pairs it trades in, with the sign flipped whenever the currency sits on the right-hand side of the pair.
Two meters can disagree completely and both be working correctly. The pair basket, lookback period, weighting, and price feed all change the result.
Central banks measure currency strength differently, using trade-weighted effective exchange rate indices. The Federal Reserve’s broad dollar index covers 26 economies, and its weights were last revised on March 24, 2025.
The US dollar was on one side of 89% of all foreign exchange trades in April 2025, according to the Bank for International Settlements. Dollar movement therefore dominates most strength rankings.
Readings are least dependable in thin liquidity, during high-impact news, and when two currencies in a basket usually move together.

A currency strength meter is a display that ranks individual currencies by recent relative performance. It converts pair prices into per-currency scores.
Forex quotes are always relative; if EUR/USD is rising by 0.4%, it tells you the euro gained on the dollar. A strength meter answers that by checking the euro against six or seven other currencies at the same time, and doing the same for the dollar.
Most meters cover the eight currencies that carry the bulk of global turnover: the US dollar, euro, Japanese yen, British pound, Swiss franc, Canadian dollar, Australian dollar, and New Zealand dollar. Some add the Chinese renminbi and other actively traded currencies.
To read any of this, you need the base currency and the quote currency straight. The base is the first currency in the pair. The quote is the second, and it is the one being measured out. In EUR/USD, the euro is the base and the dollar is the quote.
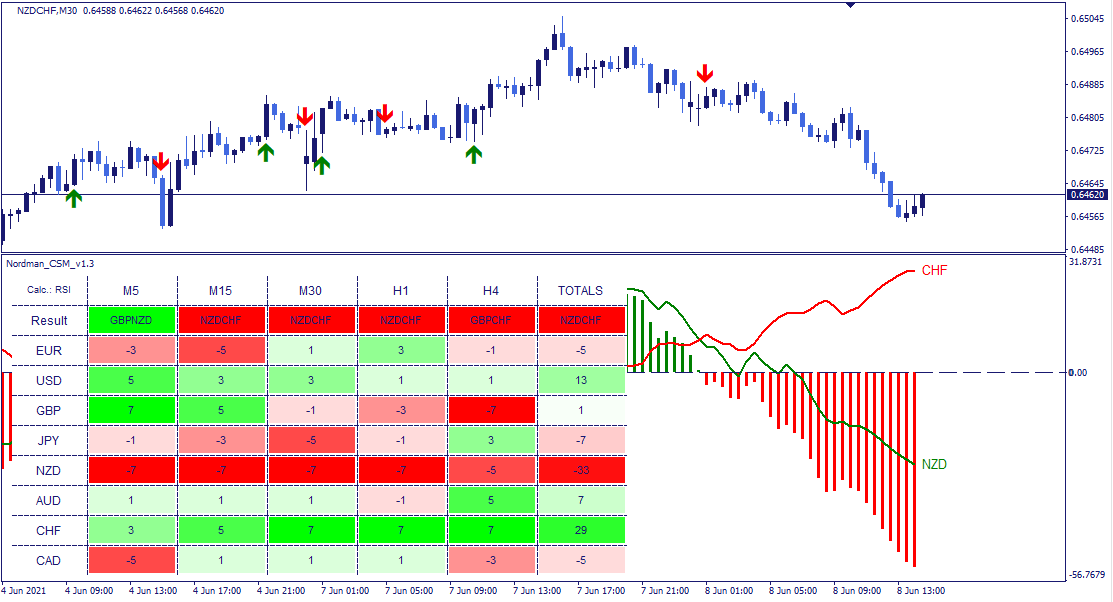
The common method is an average of signed percentage changes. Four steps produce the number.
Step 1. Choose a currency and list its pairs. The dollar trades against the other seven majors in EUR/USD, GBP/USD, AUD/USD, NZD/USD, USD/JPY, USD/CHF, and USD/CAD.
Step 2. Measure the percentage price change of each pair over a fixed lookback. Four hours, one day, one week. The period is a setting, not a fact about the market.
Step 3. Apply the sign rule. If the currency you are scoring is the base, a rising pair means it strengthened, so the change stays positive. If it is the quote, a rising pair means it weakened, so you flip the sign.
Step 4. Average the signed changes. That average is the raw strength figure. Most meters then rescale the eight raw figures onto a display scale, commonly 0 to 10 with 5 marking no net movement, or 0 to 100.
Other calculation methods exist and produce different pictures of the same market:
RSI-based meters run the Relative Strength Index on each pair and average the results per currency. These read momentum extremes rather than raw distance travelled. If you use one, the mechanics of the underlying oscillator are worth knowing first, and our guide to reading RSI signals covers them.
Moving-average deviation meters measure how far each pair sits above or below a 50- or 200-period average, then aggregate. These lean toward trend rather than short-term momentum, and they lag more.
Rate-of-change meters measure the speed of movement rather than the distance, which makes them quicker and noisier.
None of these is the correct one. They answer different questions.
Take a four-hour window with these pair changes:
Pair |
Change |
|---|---|
EUR/USD |
+0.40% |
GBP/USD |
+0.25% |
AUD/USD |
+0.10% |
NZD/USD |
+0.05% |
USD/JPY |
+0.15% |
USD/CHF |
-0.20% |
USD/CAD |
-0.10% |
Score the dollar. It is the quote currency in the first four pairs, so those signs flip. It is the base in the last three, so those stay as they are.
Signed values: -0.40, -0.25, -0.10, -0.05, +0.15, -0.20, -0.10.
Sum: -0.95. Divided by seven: -0.14%. The dollar is modestly weak.
Now score the euro, which is the base currency in all seven of its major pairs:
Pair |
Change |
|---|---|
EUR/USD |
+0.40% |
EUR/GBP |
+0.15% |
EUR/JPY |
+0.55% |
EUR/CHF |
+0.20% |
EUR/AUD |
+0.30% |
EUR/NZD |
+0.35% |
EUR/CAD |
+0.30% |
Sum: +2.25. Divided by seven: +0.32%. The euro is broadly firm.
The gap between the two scores is 0.46 percentage points, while EUR/USD itself moved 0.40%. The two figures come from different baskets, so they approximate each other without matching exactly. A trader reading this would note that euro firmness is doing more of the work than dollar weakness, since +0.32 is more than double the size of -0.14. That asymmetry is the actual output of the exercise, and it is invisible on the EUR/USD chart alone.
On a 0 to 10 scale, 5 means no net change across the basket over the lookback. Above 7 is usually treated as broad strength, below 3 as broad weakness, and 4 to 6 as a currency going nowhere in aggregate.
Three points about interpretation are worth holding.
The score is relative but not absolute. A currency reading 8 has outperformed the other seven in the basket. It has not necessarily risen against all of them, and it says nothing about value.
The score is a snapshot of a period you chose. Change the lookback from four hours to one week, and the ranking can invert. Neither ranking is wrong.
A high score is a description of what already happened. It carries no forecast. Momentum can persist or reverse, and the meter does not distinguish between the two.
This is the question that trips up most new users. Open two meters side by side and one may show the pound strongest while the other places it fourth. Both can be calculating correctly.
Input that varies |
Effect on the ranking |
|---|---|
Pair basket |
Seven majors, 28 pairs, or a set including crosses. Adding crosses changes every average. |
Lookback period |
A 15-minute window and a daily window measure different market phases. |
Weighting |
Equal weighting treats every pair the same. Trade-weighted or volatility-weighted versions do not. |
Calculation method |
Average percentage change, RSI, moving-average deviation, and rate of change each rank differently. |
Price feed and session anchor |
Providers differ on quotes and on when the trading day starts, which shifts every daily change figure. |
The practical response is to pick one meter, learn its settings, and read it consistently. Comparing readings across two differently configured meters produces confusion, not confirmation.
The standard application is to trade the currency with the highest score against the one with the lowest. The reasoning is that the widest strength differential tends to correspond to the clearest directional move, rather than the two-sided drift you get when both currencies are mid-table.
If the euro reads 8.2 and the yen reads 1.6, EUR/JPY is where the meter is pointing. Whether that pair is worth trading depends on the chart, the level, and the calendar, none of which the meter can see.

A common error is reading a 15-minute meter and holding for three days. Traders generally set direction from a higher timeframe reading, such as daily or four-hour, then look for an entry on a lower one. When the two disagree, the sensible reading is that no clear bias exists.
If a currency’s strength score has been climbing for several sessions while one of its pairs has stalled, that pair is resisting the broader flow. Something specific to the other currency is likely responsible. The same logic that governs divergence between price and momentum applies here at the basket level.
A pair where both currencies score between 4 and 6 has no strength differential behind it. Many traders use the meter mainly for this negative filter, removing candidates rather than selecting them.
Whatever the reading shows, position size is decided by account risk rules and stop distance, not by how strong the meter says a currency is. A position size calculator handles that part.
In thin liquidity. Foreign exchange runs around the clock on weekdays, and the New York Fed’s Foreign Exchange Committee describes it as operating 24 hours a day. Activity is far from evenly spread. The BIS 2025 survey found four jurisdictions accounted for around 75% of global turnover: the United Kingdom at 37.8%, the United States at 18.6%, Singapore at 11.8%, and Hong Kong SAR at 7.0%. The UK and US alone make up roughly 57%. When neither of those centers is active, volumes fall, spreads widen, and small trades push prices further. A strength reading built from those prices inherits the noise. Our guide to global forex trading hours sets out the session overlaps.
Around the daily rollover. In the minutes surrounding the daily close and the start of a new trading day, spreads widen and quotes gap. Meters anchored to the session open reset at this point, which can produce a dramatic apparent shift that reflects the anchor moving rather than the market. Widening spreads also change the cost of any trade taken on that reading, which is covered in our explainer on how forex spreads work.
Through high-impact news. A central bank decision or an inflation print can move a currency several hundred points in seconds. The meter registers it after the fact.
When currencies in the basket move together. The Australian and New Zealand dollars often move in step, as do commodity-linked currencies more broadly. If both are strong, part of each score reflects a shared driver rather than independent demand, which flatters the apparent breadth of the move. Understanding how currency pairs correlate prevents this from being read as two separate signals.
In ranging markets. When price oscillates without direction, strength scores rotate around the neutral band and flip repeatedly. Following each flip produces a sequence of small losing trades.
Neither platform ships with one built in. MetaTrader 4 includes 30 built-in technical indicators and 24 analytical objects across nine timeframes, from one minute to monthly. MetaTrader 5 extends that range. A strength meter is added as a custom indicator.
The general process is the same on both:
In the platform, open File, then Open Data Folder.
Open the MQL4 folder in MT4, or MQL5 in MT5, then open Indicators.
Place the indicator file inside that folder.
Restart the platform.
Find the indicator in the Navigator panel and drag it onto a chart.
Two points before relying on it. Check what calculation the indicator uses and over what lookback, since the defaults vary widely and determine everything the display shows. And run it on a demo account long enough to see how it behaves through a full week, including quiet Asian hours and a news release.
If you are choosing between the two platforms, our MT4 and MT5 comparison covers the practical differences, and the MT4 platform guide explains setup.
The most common method averages the percentage price change of a currency across the pairs it trades in over a set period. When the currency is the quote currency in a pair, the sign of that change is inverted. The average is then rescaled to a display range, usually 0 to 10 or 0 to 100.
On a 0 to 10 scale, 5 means no net movement across the basket. Readings above 7 indicate broad strength over the chosen period, below 3 indicate broad weakness, and 4 to 6 indicate no clear direction. The score is relative to the other currencies in the basket, and it describes past movement only.
Because the result depends on inputs the provider chooses: which pairs are in the basket, the lookback period, whether pairs are weighted equally, the calculation method, and the price feed. Two correctly built meters with different settings will rank the same currency differently at the same moment.
It depends on holding period rather than on any single correct setting. Intraday traders typically read 15-minute to four-hour windows. Swing traders use daily or weekly. Setting the meter to a much shorter window than the intended holding period is the common mistake.
It accurately reports what it measures: average past price change across a basket. It is not a forecast, and its readings degrade in thin liquidity, around the daily rollover, and during news events. Accuracy questions are usually really questions about whether the settings match the way the trader is using it.
MT4 has no built-in currency strength meter. One can be added as a custom indicator by placing the file in the MQL4 Indicators folder inside the platform’s data folder, restarting, and dragging it from the Navigator onto a chart. The same process applies to MT5 using the MQL5 folder.
A currency strength meter is a sorting tool. It compresses 28 charts into eight numbers, which is worth something on a Monday morning when you need to know where the week’s flow is running.
One habit separates traders who get value from it. Before using any meter, find out its three settings: the pair basket, the lookback, and the calculation method. Providers rarely put these on the front page. Once you know them, the number stops being an opinion delivered by software and becomes a measurement you can interpret, question, and cross-check against the chart in front of you.
For the wider context on how pairs are quoted, priced, and traded, start with the forex trading fundamentals hub, and see which currency pairs carry the deepest liquidity before deciding what the meter’s top-ranked currency is actually tradeable against.
Disclaimer: This material is for general information purposes only and is not intended as (and should not be considered to be) financial, investment or other advice on which reliance should be placed. No opinion given in the material constitutes a recommendation by EBC or the author that any particular investment, security, transaction or investment strategy is suitable for any specific person.