Published on: 2025-12-02
Updated on: 2025-12-02
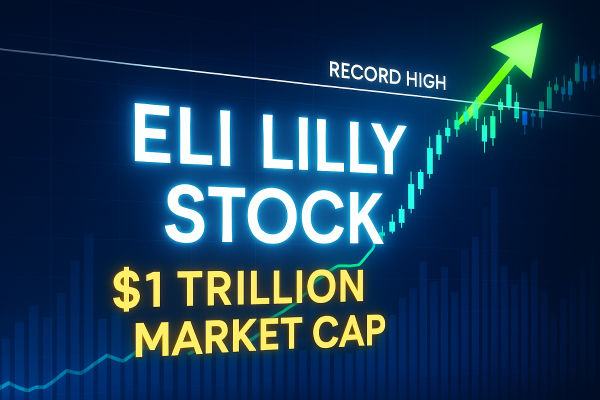
Eli Lilly (LLY) has just pulled off a rare combination: a breakout to fresh highs, a $1 trillion valuation, and a parabolic November rally of roughly 30% in a single month. For traders, it now sits in that tricky zone where momentum is powerful, but late buyers risk chasing.
LLY trades around $1,060 today, close to a 52-week high near $1,112 and comfortably above its 52-week low near $624. The trend is firmly bullish, but most key indicators are flashing “strong trend plus overbought,” not “cheap.”

This breakdown focuses on what matters now: the short-term and medium-term trend, the levels that define the current move, how far the rally could stretch, and where the bullish story would start to crack, with a clear trading framework for LLY.
Snapshot (using closing data through Nov 30, 2025 and live price around $1,060 on Dec 2, 2025):
Overall technical bias: Bullish, but stretched after an explosive November rally.
Short-term (next 1–2 weeks): Base case is a consolidation or shallow pullback while price holds roughly above $1,000, with repeated attempts to push toward $1,110–$1,130.
Medium-term (next 1–3 months): As long as LLY stays above the 50-day moving average near $880–$900, the path favours higher highs toward $1,150–$1,200.
Long-term (next 6–12 months): The structure remains constructive while price holds above the rising 200-day moving average around $805. Deeper pullbacks into the $850–$900 zone would still sit inside an uptrend.
Invalidation: A sustained daily close below the 50-day moving average (currently about $882) would signal that the vertical phase has cooled and open room toward the $800–$820 band.
Volatility comment: With ATR(14) near $29 and elevated trend strength, traders should assume wide daily ranges and sharper swings around any new GLP-1 headlines, earnings updates, or pricing news.
Base case: LLY continues to trade with a bullish bias toward $1,110–$1,150 as long as it defends the $1,000–$1,020 support band. A clean break below that area would shift focus to $900 and then the 200-day moving average.
The latest daily readings show a textbook "extended uptrend" profile: moving averages stacked bullishly, strong trend strength, and momentum indicators in overbought territory rather than in early-stage breakout mode.
All indicator values are taken from daily data as of Nov 30, 2025; price has since eased slightly but the overall signal mix remains similar.
| Indicator / Level | Latest Value | Signal / Comment |
|---|---|---|
| 50-day Simple Moving Average | $881.51 | Price well above; short-term trend solidly bullish. |
| 200-day Simple Moving Average | $804.95 | Long-term uptrend intact while price stays above this rising base. |
| RSI (14, Daily) | 73.61 | Overbought zone; rally is mature and vulnerable to consolidation or pullback. |
| MACD (12,26, Daily) | 63.96 | Positive but stretched; momentum strong, room for mean reversion if signals roll. |
| Key Support | $1,000–$1,020 | First demand area near 20-day MA and recent breakout shelf. |
| Key Resistance / Target | $1,110–$1,130 | Near 52-week high and pivot resistance cluster; natural profit-taking zone. |
| ATR (14) | 28.98 | Elevated daily range; position sizing needs to respect large swings. |

After grinding inside a downward channel for more than a year, LLY broke out sharply following a strong earnings report and exploded through the psychological $1,000 line in November. The rally then accelerated, a classic late-stage push that often reflects FOMO rather than calm accumulation.
Daily candles sit well above the 20-day moving average near $1,001, with the 5- and 10-day averages tightly hugging price. RSI is above 70 and pointing slightly lower, hinting at fatigue. In trend terms, the uptrend is healthy; in momentum terms, it looks hot and due for a pause rather than just beginning.
On the weekly chart, the structure is clean: higher highs, higher lows, and a decisive escape from the prior channel. The 50-day and 200-day moving averages are both rising and clearly stacked in bullish order, with price more than $150 above the 50-day average.
This separation shows strength but also implies that a "normal" corrective phase could be sizeable in dollar terms without doing real damage to the broader trend. Swings of $80–$120 from peak to trough would still leave LLY comfortably above its long-term support bands.
From a long-term perspective, LLY has transformed into one of the equity market’s core growth stories. The stock has climbed more than 30% over the past year and over 600% over five years, powered by GLP-1 obesity and diabetes franchises.
The 200-day moving average around $805 roughly lines up with the prior consolidation area from earlier in the year. That zone marks the structural “line in the sand” for the long-term bull story. As long as price stays comfortably above that rising base, pullbacks look more like resets than trend reversals.
$1,000–$1,020:
Aligns with the 20-day moving average and the psychological four-figure mark.
Also near the post-breakout congestion area after the first run above $1,000, where dip buyers previously stepped in.
$880–$900 (50-day MA region):
First deeper support if the market decides to unwind part of the November surge.
A retest of this band would still sit comfortably inside the larger uptrend and could attract medium-term buyers.
$800–$820 (200-day MA area):
Long-term trend floor; a break here would mark a genuine shift in market perception of LLY’s GLP-1 story.
$1,110–$1,120:
Near the 52-week high around $1,112 and just above classic pivot resistance (R1–R2 cluster).
Logical area for short-term traders to trim risk or trail stops tighter.
$1,150–$1,200:
Extension target if momentum resumes and buyers push past the current highs.
Given ATR of almost $30, a few strong sessions could carry price toward this band without any change in the broader narrative.
Scenario framing: If price clears and holds above roughly $1,120 with firm volume, the path toward $1,150–$1,200 opens up. Failure to break that band, combined with softening RSI and MACD, would favour a sideways or corrective phase back toward $1,000.
For the current bullish view, the practical invalidation band sits in two stages:
Short-term invalidation: A sustained daily close below the 50-day moving average around $882 would tell you the November vertical rally has broken.
Structural invalidation: A move below $800 and the 200-day moving average would signal that the GLP-1 optimism is being repriced more fundamentally.

Conditions: LLY holds above $1,000–$1,020, RSI cools slightly out of overbought without a deep price slide, and new GLP-1 or pricing headlines remain constructive.
Targets: First toward $1,110–$1,130, then potentially $1,150–$1,200 if trend strength (ADX above 50) persists.
Risk: A break back inside the $950–$1,000 band and loss of the 50-day MA would downgrade the scenario from strong trend to standard range.
Conditions: Price slices below $1,000, RSI continues to retreat from overbought, and the market leans into profit-taking after the $1T milestone and the fast November run.
Consequences: A deeper pullback into $900–$920, with risk of extension toward the $850–$880 region if macro risk sentiment worsens or GLP-1 pricing pressure intensifies.
Conditions: No fresh blockbuster headlines, WHO and regulatory messaging stabilises, and the market digests recent gains while waiting for the next earnings or trial readout.
Range: LLY trades between roughly $1,000 support and $1,120 resistance, with swings inside that band driven more by general risk appetite than stock-specific catalysts.
The last report showed EPS and GLP-1 revenues comfortably ahead of expectations, which fuelled the current leg higher. Any slowdown in Mounjaro/Zepbound growth or a cautious tone on 2026 guidance would matter for the trend.
Lilly just cut Zepbound prices across several doses to widen access, following a broader deal with the U.S. government. This helps volume but can compress margins if price cuts exceed volume gains.
Novo Nordisk continues to advance next-generation obesity treatments such as amycretin, with positive mid-stage data and plans for late-stage trials. Any evidence that competitors are closing the efficacy gap could cool LLY’s premium valuation.
WHO’s supportive stance on GLP-1 therapies confirms long-run demand, but comments on access and affordability highlight ongoing political and budget risk.
With LLY trading on rich multiples, broad risk-off moves in equities could trigger outsized swings as investors trim high-beta and crowded growth favourites.
Technical setups in a headline-driven pharma leader can change quickly. Levels work until a fresh data point or policy headline forces re-pricing.
LLY’s daily RSI sits above 70, which is typically viewed as overbought, while ADX above 50 signals a powerful trend.
The first line of support sits around $1,000–$1,020 near the 20-day moving average and recent breakout shelf. Deeper support appears in the $880–$900 region around the 50-day moving average, with the $800–$820 area tied to the rising 200-day base.
If LLY holds above $1,000, the immediate focus is on the $1,110–$1,130 band near recent highs and pivot resistance. A clean break and weekly close above that area could extend the move toward $1,150–$1,200 while the broader GLP-1 story remains intact.
Moving averages (20-, 50-, and 200-day) help define the trend and key pullback zones, while RSI and MACD show how stretched the latest rally has become. ATR and ADX quantify volatility and trend strength, useful for adjusting position size and stop placement.
Yes. The last earnings beat and raised guidance triggered the breakout above the prior channel and the surge through $1,000. Future earnings or GLP-1 updates can override near-term technical levels temporarily, so traders should track key dates alongside charts.
LLY sits in a powerful uptrend, supported by GLP-1 leadership, a fresh $1T valuation, and strong demand for its obesity and diabetes portfolio. The chart reflects that strength: price is well above rising 50- and 200-day moving averages, with only momentum indicators hinting at short-term exhaustion.
For now, the crucial levels are $1,000–$1,020 on the downside and $1,110–$1,130 on the upside. Above that band, a drive toward $1,150–$1,200 becomes realistic; below the 50-day moving average, the focus shifts to a more conventional correction.
Scenarios can change quickly as fresh earnings, pricing decisions, or regulatory news hit the tape. If you plan to trade LLY, consider doing so with disciplined risk management, clear levels, and an honest view of volatility.
Disclaimer: This material is for general information purposes only and is not intended as (and should not be considered to be) financial, investment or other advice on which reliance should be placed. No opinion given in the material constitutes a recommendation by EBC or the author that any particular investment, security, transaction or investment strategy is suitable for any specific person.