Published on: 2025-08-11
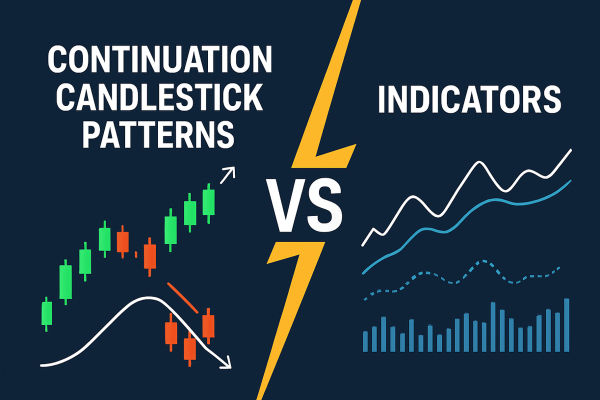
Continuation candlestick patterns are chart formations that suggest a prevailing trend — whether upward or downward — is likely to continue after a brief pause or consolidation. They are formed by specific combinations of candlesticks over one or more sessions and reflect the ongoing balance between buying and selling pressure.
For example, in an uptrend, a continuation pattern often appears as a short period of indecision or minor retracement before the next leg higher. In a downtrend, it may appear as a temporary halt in selling before the decline resumes. These patterns work because market trends rarely move in a straight line. Instead, they unfold in waves, and continuation candlestick patterns give traders visual cues that the pause is temporary.
Common continuation patterns include formations like the Rising Three Methods, Falling Three Methods, Bullish Flags, Bearish Flags, and Pennants when applied in candlestick form. Although each has its own structure, they share the underlying theme of confirming the trend rather than signalling a reversal.
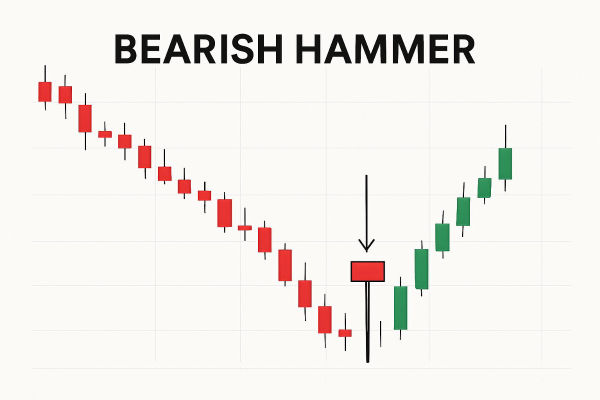
To appreciate the value of continuation candlestick patterns, one must understand the psychology behind them. In an uptrend, strong bullish candles are sometimes followed by smaller candles with limited range, showing that the market is catching its breath. This pause can be due to profit-taking, short-term uncertainty, or low-volume sessions. However, the lack of a strong counter-trend move suggests that sellers are not in control, and buyers are still dominant.
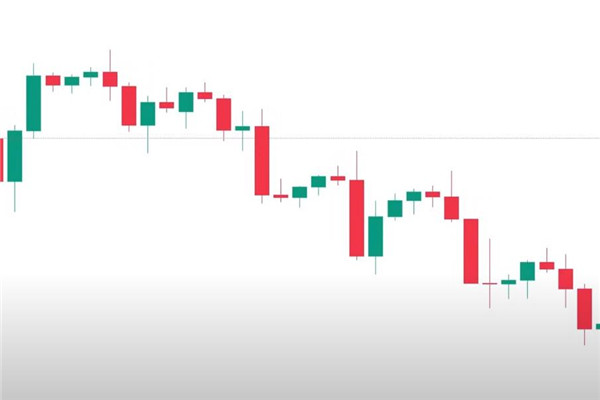
In a downtrend, bearish continuation patterns work similarly. A series of strong selling candles might be interrupted by small-bodied candles or brief upward moves, reflecting temporary buying interest. But if that interest fails to generate momentum, the selling pressure often returns with equal or greater strength.
Recognising these pauses for what they are — temporary interruptions — is what makes continuation candlestick patterns useful. Traders who can correctly identify these formations can re-enter trades with the trend or hold existing positions longer, maximising profit potential.
Technical indicators are algorithm-based tools applied to price charts to help interpret market data and identify potential trading opportunities. They can be trend-following, momentum-based, volatility-based, or volume-based. Examples include Moving Averages, the Relative Strength Index (RSI), Moving Average Convergence Divergence (MACD), Bollinger Bands, and the Average True Range (ATR).
Indicators take historical price and volume data and apply mathematical formulas to produce values that can be plotted alongside or over the price chart. Traders then interpret these values as potential buy or sell signals. Indicators can help reduce subjectivity, as their calculations are rule-based and consistent. However, because they are derived from past price data, many indicators are lagging in nature, meaning they confirm a move after it has begun.
When comparing continuation candlestick patterns to technical indicators, the key difference lies in their nature. Continuation patterns are derived directly from price action and reflect market sentiment in real time. Indicators are derived from price and volume data but processed mathematically, often smoothing or delaying the signal.
Continuation candlestick patterns are ideal for traders who prefer visual, intuitive analysis and want to capture moves as they develop. Indicators are better suited for traders who want rule-based confirmation and the ability to back-test strategies easily.
Many experienced traders combine both. For example, a trader may identify a bullish continuation pattern on a chart and then look for a moving average crossover or an RSI trendline break for confirmation. This blend can balance the immediacy of candlestick signals with the objectivity of indicators.
If you are trading in a strong, clearly defined trend and want to maximise profits by re-entering after pullbacks, continuation candlestick patterns can give timely signals. They are especially effective in markets with high liquidity and good volume, such as major forex pairs or large-cap Indian stocks, where chart patterns are cleaner.
They are also advantageous when trading shorter timeframes, as the speed of formation allows for quick decision-making. Experienced intraday traders often rely on these patterns during market openings, earnings announcements, or global events, where speed matters.
If you are a newer trader or prefer a more systematic approach, indicators can be more forgiving. They can help filter out false signals and provide confirmation before committing capital. Longer-term traders who are less concerned with capturing every pip or rupee of movement may value the steadiness that indicators bring.
Indicators are also useful in range-bound markets, where continuation patterns may be less reliable. Oscillators like RSI or Stochastics can highlight reversals within a range, offering opportunities that pattern-based trading might miss.
The most effective approach for many traders is to combine continuation candlestick patterns with technical indicators. This offers the best of both worlds — the immediacy of patterns and the confirmation of indicators. For example, you might spot a bullish flag pattern in an uptrend and confirm it with a moving average alignment or volume spike before entering the trade.
By setting clear rules for how patterns and indicators interact in your strategy, you can reduce false signals and improve consistency. For Indian traders, this blended approach works well across asset classes, from NSE-listed stocks to forex pairs and even cryptocurrencies, provided they are traded through compliant platforms.
The debate between continuation candlestick patterns and technical indicators isn’t about which is universally better — it’s about which fits your style, experience level, and the market conditions you trade. Continuation candlestick patterns offer real-time, sentiment-driven insights into market momentum, while indicators provide rule-based confirmation and help manage emotional bias.
The key is adaptability. Markets change, and so should your approach. There will be times when continuation candlestick patterns alone give you the edge, and times when indicator confirmation prevents costly mistakes. Learning to recognise when to prioritise one over the other — or when to combine both — is the hallmark of a well-rounded, disciplined trader.
(Disclaimer: This material is for general information purposes only and is not intended as (and should not be considered to be) financial, investment or other advice on which reliance should be placed. No opinion given in the material constitutes a recommendation by EBC or the author that any particular investment, security, transaction or investment strategy is suitable for any specific person.)