Published on: 2025-05-15
The gravestone doji stands out among the various candlestick patterns used to analyse price movements for its unique structure and potential implications.
Often considered a bearish reversal signal, this candlestick pattern determines whether a trend is losing momentum. But is it always a reliable sign of an upcoming drop?
This article will explore the gravestone doji in detail, including what it is, how to identify it, its psychological interpretation, how to trade it effectively, and when it might give false signals.

A gravestone doji is a type of single-candle formation on a price chart. It features a long upper shadow, little or no real body, and almost no lower shadow. When the open, low, and close prices are near the same, the pattern appears with the high significantly above those levels.
The pattern appears as a "T" shape and is typically associated with bearish sentiment, especially after an uptrend. It suggests buyers pushed prices higher during the session, but sellers ultimately regained control, forcing the price back to the opening level.
Anatomy
To truly understand the gravestone doji, it helps to break it down technically. The essential features include:
Open = Close = Low
High = Upper Shadow
No or minimal lower shadow
Long upper wick
This structure signals a massive shift in intraday sentiment. Bulls were in control for most of the trading session, but bears reversed the gains by the close, creating a rejection or exhaustion of buying interest.
Gravestone Doji vs. Other Doji Patterns
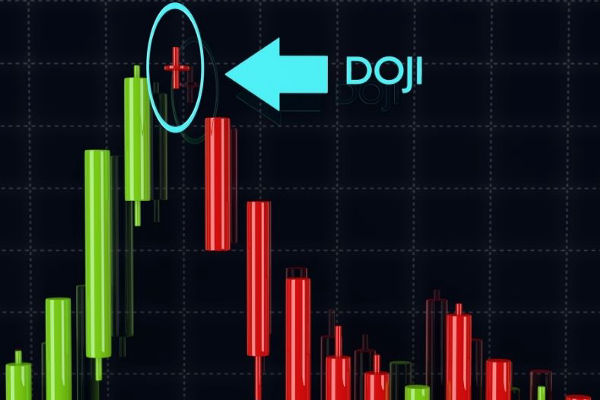
Standard Doji: Appears like a plus sign with small upper and lower shadows, indicating indecision.
Dragonfly Doji: Has a long lower shadow and no upper shadow, usually indicating a bullish reversal.
Gravestone Doji: Long upper and no lower shadow, often a bearish signal.
While all Dojis signify market indecision, the position of shadows determines the likely directional bias. The Gravestone Doji is bearish because the price fails to hold its highs.
The effectiveness of a Gravestone Doji largely depends on where it appears on the chart.
In a Uptrend
This is where the Gravestone Doji is most potent. Appearing after a strong bullish run, it may signal buyer exhaustion and a potential trend reversal. The sudden failure to hold highs reflects waning bullish momentum and growing bearish pressure.
In a Downtrend
When it forms during a downtrend, it may not have significance. Some traders might interpret it as a continuation signal or simple hesitation rather than a real reversal pattern.
In Consolidation Zones
Within sideways markets or consolidation zones, a Gravestone Doji often signals short-term resistance. It may lead to a pullback or breakdown, but not necessarily a full-blown trend reversal.
Different Timeframes
This pattern is visible across timeframes, but its reliability changes:
Daily Chart
The most reliable signals often appear on daily candles. Traders widely observe daily charts, and patterns here reflect meaningful price action.
Weekly Chart
On weekly charts, Gravestone Doji formations indicate potential long-term reversals. These are rare but powerful when they align with other bearish signals.
Intraday Charts
On 5-minute or 15-minute charts, Gravestone Dojis can lead to quick scalping opportunities. However, they're less reliable due to noise and market volatility.
Adjust your expectations and risk management according to the timeframe.

Step 1: Confirm the Context
Make sure the pattern appears after a clear uptrend. The longer and steeper the prior rally, the more meaningful the reversal signal.
Step 2: Wait for Confirmation
Look for a bearish candle following the Doji, such as a long red candle or a gap down. It suggests that sellers are following through with downward pressure.
Step 3: Entry Strategy
Consider entering a short position below the pattern's low or after the close of the confirmation candle. Use proper risk management—set stop-loss orders above the high of the Doji.
Step 4: Set Realistic Targets
Don't expect every gravestone doji to lead to a massive selloff. Use nearby support levels or Fibonacci retracements as profit targets.
Use with Other Indicators
To improve reliability, traders often combine the Gravestone Doji with other technical indicators or tools:
Moving Averages
If the Doji forms near a key moving average (like the 200-day MA), its reversal potential increases. A failure to break above resistance aligns with the bearish interpretation.
RSI (Relative Strength Index)
If the doji appears when RSI is overbought territory, it reinforces the case for a pullback or reversal.
Volume Analysis
High volume on the Gravestone Doji day can signal significant institutional selling. A low volume may indicate a weaker signal.
Real-World Examples
Example 1: Tesla (TSLA) – June 2020
In mid-2020, Tesla stock surged, reaching overbought levels, signalling a gravestone doji on the daily chart after a strong rally. The following day, TSLA opened lower and began a multi-day correction, falling over 15%.
Here, the Gravestone Doji acted as a clear bearish reversal signal, especially when confirmed with volume and rsi divergence.
Like any technical tool, the pattern isn't perfect. False signals occur frequently, specifically:
During low-volume sessions
In highly news-driven markets
Without confirmation from trends or indicators
For example, a Gravestone Doji might form in an uptrend, only for the next candle to break higher and continue the rally. In such cases, the pattern becomes a temporary pause rather than a reversal.
Avoid using it in isolation. Confirm with trendlines, volume, indicators, or Chart Patterns before taking action.
In conclusion, the gravestone doji is a powerful visual cue in candlestick charting. While it is normally seen as a bearish reversal pattern, it doesn't guarantee a trend change. Its value lies in context, confirmation, and confluence with other trading tools.
Therefore, look for it after uptrends, confirm it with volume and a following bearish candle, and combine it with other forms of technical analysis. By doing so, you can avoid false signals and improve your market timing.
Disclaimer: This material is for general information purposes only and is not intended as (and should not be considered to be) financial, investment or other advice on which reliance should be placed. No opinion given in the material constitutes a recommendation by EBC or the author that any particular investment, security, transaction or investment strategy is suitable for any specific person.