Published on: 2025-10-17
Updated on: 2025-10-17
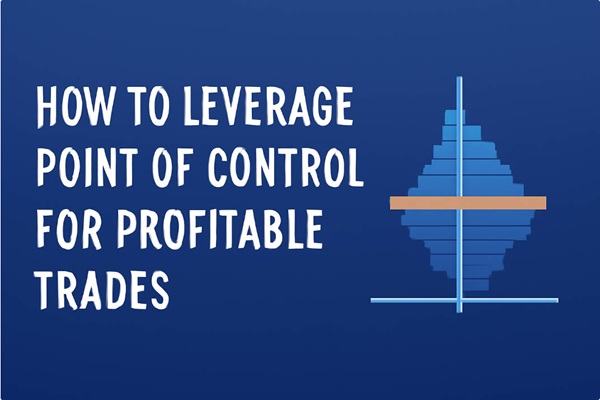
Point of Control (POC) is a powerful tool that reveals critical price levels where most trading volume occurs, helping traders spot key areas of support, resistance, and trend continuation.
By leveraging POC, traders can make informed decisions on breakouts, reversals, and risk management.
In this article, we'll explore how to use POC to enhance your trading strategy and maximise profitability.

The POC is a vital component of Market Profile, a charting technique developed by J. Peter Steidlmayer in the 1980s. Market Profile helps traders visually represent market activity over time, with POC being the key reference point. Here's a breakdown of its components:
Market Profile:
A method of charting that displays price distribution over a specified time period. It shows where most of the trading activity occurred, which is typically where the market has found value.
Volume and Price:
POC is determined based on volume traded at various price levels. It reflects the price level where the most significant number of trades were executed, often signalling equilibrium between buyers and sellers.
While some traders rely on technical indicators like the moving average or Relative Strength Index (RSI), POC provides a more dynamic insight into market action by integrating price and volume information.
This makes it especially useful for trend identification, price reversal signals, and breakout predictions.
 Understanding how to identify the POC is the first step in leveraging it for effective trading. Here's how you can pinpoint the POC on your chart:
Market Profile:
Using a chart with Market Profile indicators, you can clearly see the distribution of price and volume. The POC is usually the price point with the highest volume, shown as the "Value Area" where 70% of trades have occurred.
Tools for POC:
Most charting platforms like MetaTrader, TradingView, and NinjaTrader offer built-in Market Profile indicators. These can help traders easily identify and plot the POC.
A typical Market Profile chart will display a bell-shaped curve, with the highest point of the curve representing the POC. The range of prices where most trades took place is known as the "Value Area" surrounding the POC.

POC plays an integral role in multiple trading strategies. Below are some common methods for trading with POC:
The POC often acts as a key level of support or resistance. When the market is trading above the POC, the POC can act as support; when trading below, it can act as resistance.
Example: If the price approaches the POC from below and bounces upwards, it can signal a buying opportunity.
Breakout: A breakout occurs when the price breaks above or below the POC, indicating potential momentum in the direction of the breakout.
Reversal: A reversal strategy is used when price approaches the POC, fails to break through, and moves back in the opposite direction.
If the price moves above the POC and holds, this could indicate the continuation of an uptrend. Similarly, holding below the POC may indicate the continuation of a downtrend.
Example: If the POC acts as a pivot point and price consolidates above it, traders may interpret this as a bullish sign for trend continuation.
Effective risk management is crucial in trading, and POC can help traders in this area by providing clear levels for stop-loss placement, position sizing, and trade management.
Traders often place stop-loss orders just beyond the POC level.
If the price breaks the POC, it may indicate a failed trade, and the stop-loss will help limit potential losses.
When trading near the POC, position sizes may be adjusted depending on how close the price is to the POC.
The closer the price is to the POC, the more confidence a trader might have in its significance.
By measuring the distance from the POC to the next likely support or resistance level, traders can estimate the potential risk and reward for their trades.
A larger distance between entry and target levels allows for a better risk/reward ratio.
")
While POC is an excellent tool, there are several common mistakes traders often make when using it:
Relying solely on POC without considering other factors like market news, overall trend, or other indicators can lead to poor trading decisions.
Just because the price breaks above or below the POC does not guarantee a strong trend. Traders must watch for confirmation signals, such as volume increases or momentum indicators, before entering trades.
Traders often misunderstand POC as a standalone signal. It should always be used in conjunction with other technical analysis tools, such as volume analysis, candlestick patterns, or price action.
To enhance trading strategies, many traders combine POC with other technical analysis tools:
Candlestick patterns, such as pin bars or engulfing patterns, can provide additional confirmation when trading around the POC.
POC can be used alongside sentiment analysis to gauge whether market participants are favouring the long or short side at any given time.
Combining POC with volume analysis can help identify price levels where volume increases, strengthening the significance of POC as a support or resistance level.
| Indicator | Main Use | POC Advantages | POC Disadvantages |
|---|---|---|---|
| POC (Point of Control) | Identifying price acceptance levels. | Directly shows market equilibrium. | May not capture short-term volatility. |
| VWAP (Volume Weighted Average Price) | Intraday price trend confirmation. | Ideal for intraday traders. | Less effective for long-term trend analysis. |
| Moving Average (MA) | Smoothing price action to identify trends. | Can highlight trends like POC. | Lags behind market movement. |
| Relative Strength Index (RSI) | Identifying overbought/oversold conditions. | Helps avoid overbought/oversold traps. | Can give false signals in trending markets. |
| Bollinger Bands | Measuring volatility and overbought/oversold conditions. | Works well with POC for volatility confirmation. | Can be misleading in low-volatility conditions. |
In an uptrend, the price approaches the POC but fails to break through, consolidating around it before continuing higher.
Traders who recognised this as a potential support level would have entered a buy trade with a stop just below the POC.
Conversely, a trader may see price approaching the POC, but the breakout fails, and the price falls.
In such cases, traders may opt for short positions or wait for better confirmation.

For experienced traders, POC offers advanced strategies:
Traders may compare POC levels across different timeframes (e.g., daily vs. 4-hour) to gain a better understanding of key price levels in both the short- and long-term market context.
POC is not restricted to a single asset class.
Traders can use it in various markets, such as stocks, commodities, and forex, to identify value areas and potential breakout points.
Traders often integrate POC trading strategies into broader approaches, considering factors like market cycles, seasonality, and global economic factors.
Point of Control (POC) is an invaluable tool for traders, offering unique insights into market balance, price levels, and volume activity.
By incorporating POC into their trading strategies, traders can make more informed decisions, identify potential support and resistance levels, and manage risk more effectively.
POC is the price level with the highest trading volume within a specific period, indicating the market's point of equilibrium.
POC often serves as a support level when prices are above it and resistance when prices are below it.
POC is found on Market Profile charts, marked as the price level with the highest volume during a set timeframe.
POC is most effective when combined with other tools like price action and volume analysis for confirmation.
Traders typically set stop-loss orders just beyond the POC to manage risk and adjust position sizes based on proximity to key levels.
Yes, POC can be used in various markets, including stocks, forex, and commodities, but its effectiveness may vary by market conditions.
Yes, when price stays consistently above or below POC, it can confirm a trend and indicate potential trade entries.
Disclaimer: This material is for general information purposes only and is not intended as (and should not be considered to be) financial, investment or other advice on which reliance should be placed. No opinion given in the material constitutes a recommendation by EBC or the author that any particular investment, security, transaction or investment strategy is suitable for any specific person.