Trading gold effectively requires more than simply tracking price movements. To stay ahead in volatile markets, experienced traders turn to advanced technical strategies that combine price Chart Patterns, indicators, and broader macroeconomic context. When applied correctly, these tools can offer valuable insights into potential market reversals, continuation trends, and optimal entry or exit points. This guide explores several tried-and-tested technical strategies for gold trading, including how to combine them with fundamental analysis to improve decision-making.
Gold Price Chart Patterns (Flags, Head & Shoulders, Double Tops)
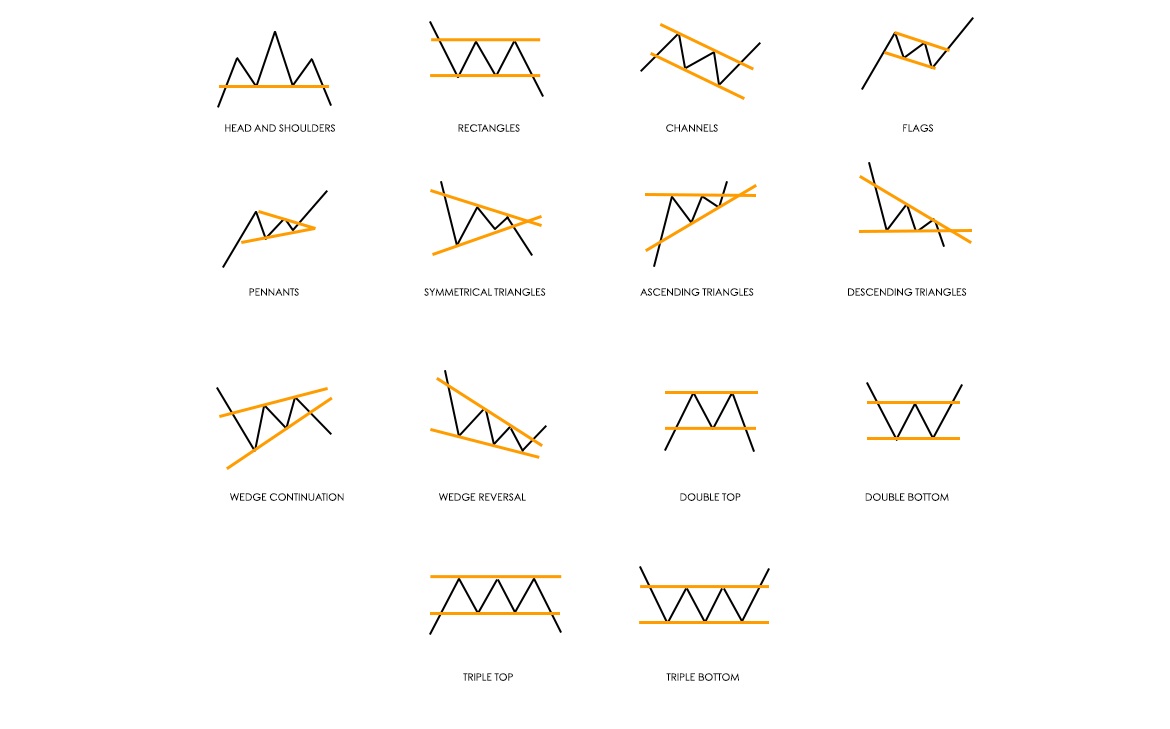
Chart patterns form the foundation of technical analysis. In gold trading, certain price formations repeatedly occur and tend to signal specific outcomes. Among the most widely recognised are flags, head and shoulders, and double tops.
Flag patterns are continuation formations that appear after a strong price movement, followed by a brief consolidation phase. In the context of gold, a bullish flag emerges when prices surge and then pull back slightly in a narrow range, resembling a flag on a pole. A breakout from the consolidation zone often signals that the original uptrend is about to resume.
Head and shoulders patterns, on the other hand, often indicate a potential reversal. The classic head and shoulders configuration consists of a peak (shoulder), a higher peak (head), and a subsequent lower peak (second shoulder), all aligned by a common neckline. When gold prices break below the neckline, it's typically viewed as a sign that upward momentum is weakening, possibly leading to a broader downturn. The inverse head and shoulders is just as important — often suggesting a bullish reversal.
Double tops and double bottoms are also commonly observed in gold trading. A double top suggests that the price has tried and failed to break a key resistance level twice, typically pointing to bearish pressure. Conversely, a double bottom signals a strong support level and potential upside reversal. Recognising these patterns in real time allows traders to anticipate likely price movements and plan trades with more confidence.
Using Moving Averages (50-day, 200-day) & Golden Cross Strategy
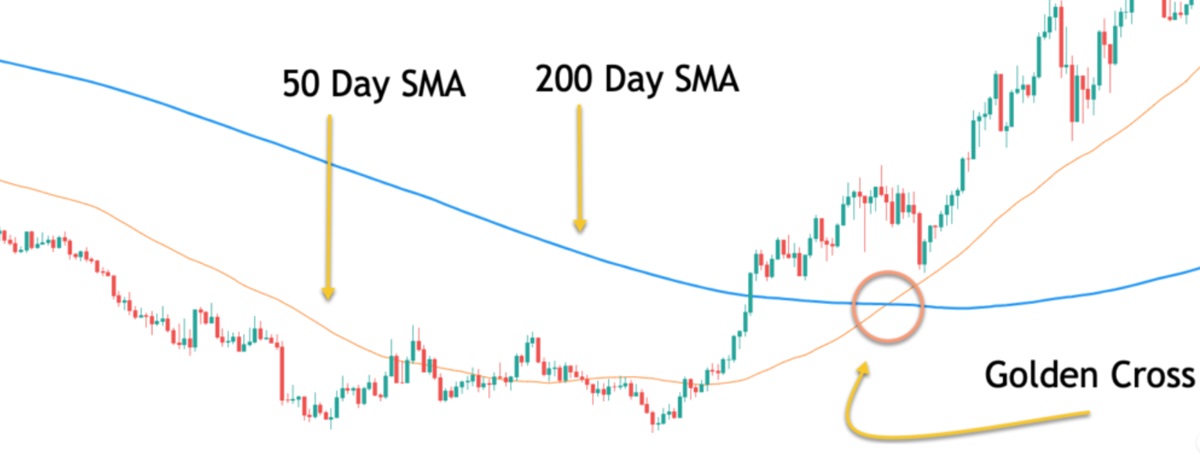
While chart patterns give visual cues, moving averages help smooth out price data and highlight longer-term trends. In gold trading, the 50-day and 200-day simple moving averages (SMAs) are especially useful for identifying momentum and potential reversals.
When the 50-day SMA crosses above the 200-day SMA, it forms what's known as a "golden cross" — often interpreted as a bullish signal. This crossover suggests that short-term momentum is catching up with and potentially overtaking the long-term trend. Many traders take this as confirmation to enter long positions.
On the flip side, a "death cross" occurs when the 50-day SMA falls below the 200-day, pointing to weakening momentum and possibly an impending downtrend. This setup can be used to trigger exit strategies or short positions.
Moving averages also act as dynamic support and resistance levels. Gold prices frequently bounce off these lines, especially in trending markets. For example, a gold price that pulls back to the 200-day SMA during an uptrend and then resumes climbing may offer a clear long entry point, particularly when supported by other indicators.
RSI, MACD & Bollinger Bands for Gold Trading
Momentum indicators add another layer of analysis, helping traders measure the strength and direction of a trend. Three of the most widely used are the Relative Strength Index (RSI), the Moving Average Convergence Divergence (MACD), and Bollinger Bands.
The RSI is a bounded oscillator ranging from 0 to 100. In gold trading, readings above 70 often indicate overbought conditions, while readings below 30 may suggest that gold is oversold. These levels are frequently used to spot potential reversal points — for example, if gold becomes overbought near a strong resistance level, a short trade might be considered.
MACD, meanwhile, tracks the difference between two moving averages and is used to identify trend direction and momentum shifts. When the MACD line crosses above the signal line, it indicates bullish momentum. A cross below suggests bearish sentiment. Divergences between MACD and gold price can also be telling — for instance, if prices hit new highs but MACD fails to follow suit, it could signal underlying weakness.
Bollinger Bands offer a visual representation of volatility. They consist of a moving average flanked by upper and lower bands, usually set two standard deviations away. In gold trading, prices nearing or breaching the upper band may indicate overextension, while a move to the lower band could signal a potential bounce. When the bands contract tightly, it usually precedes a sharp breakout in either direction.
Using these indicators together can help traders confirm signals and avoid false breakouts. For example, an RSI reading above 70. combined with a MACD crossover and a price spike above the upper Bollinger Band, could reinforce the likelihood of a pullback.
Fibonacci Retracement in Gold Trading
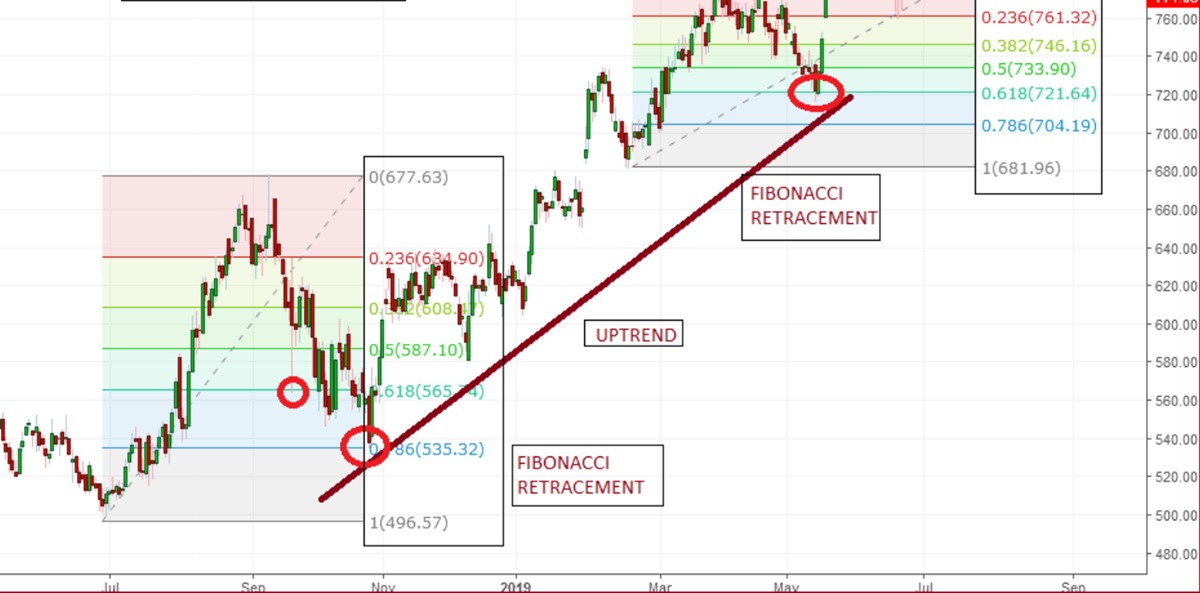
Another essential tool in the technical trader's kit is the Fibonacci retracement. Based on key ratios derived from the Fibonacci sequence — particularly 38.2%, 50%, and 61.8% — these levels help identify where price corrections might end and the prevailing trend could resume.
When gold prices trend strongly in one direction, they often retrace a portion of that move before continuing. The 38.2% and 61.8% levels tend to act as psychological support or resistance zones. For example, if gold surges from $1.800 to $2.000 and begins to pull back, traders often watch for a bounce near the $1.923 or $1.876 levels — corresponding to 38.2% and 61.8% retracements.
Fibonacci levels become even more powerful when they coincide with other technical indicators. If a retracement level aligns with a major moving average or a previously tested support line, it strengthens the case for a potential reversal or continuation. Traders can use this confluence to time entries with tighter stop-losses and better-defined risk.
Combining Fundamental & Technical Analysis
While technical strategies offer precise entry and exit points, they can be significantly enhanced by keeping an eye on fundamental developments. Gold is especially sensitive to macroeconomic indicators such as US CPI data, non-farm payrolls, and interest rate decisions by the Federal Reserve.
For instance, higher-than-expected inflation figures typically drive gold prices higher as traders seek refuge from currency debasement. On the other hand, rising interest rates — which increase the opportunity cost of holding non-yielding assets like gold — can pressure prices lower.
The key is to align technical setups with the broader macroeconomic picture. A bullish flag pattern forming just as CPI data surprises to the upside may present a high-confidence long opportunity. Similarly, if a golden cross appears while the Fed signals a pause in rate hikes, it could reinforce the strength of the technical signal.
This integrated approach reduces the risk of acting solely on technical indicators during periods of heightened market sensitivity. By layering fundamental awareness onto chart-based strategies, traders are better equipped to anticipate market reactions and avoid being caught off guard.
Final Thoughts
Gold trading can be richly rewarding for those who take the time to understand its technical dynamics. Whether spotting a textbook double top or using RSI and MACD in tandem, the key lies in consistent application and strategic patience. Integrating these techniques with fundamental insights — rather than relying on them in isolation — offers a balanced approach that suits the complexity of today's markets.
Disclaimer: This material is for general information purposes only and is not intended as (and should not be considered to be) financial, investment or other advice on which reliance should be placed. No opinion given in the material constitutes a recommendation by EBC or the author that any particular investment, security, transaction or investment strategy is suitable for any specific person.


