Published on: 2026-02-16
Updated on: 2026-02-16
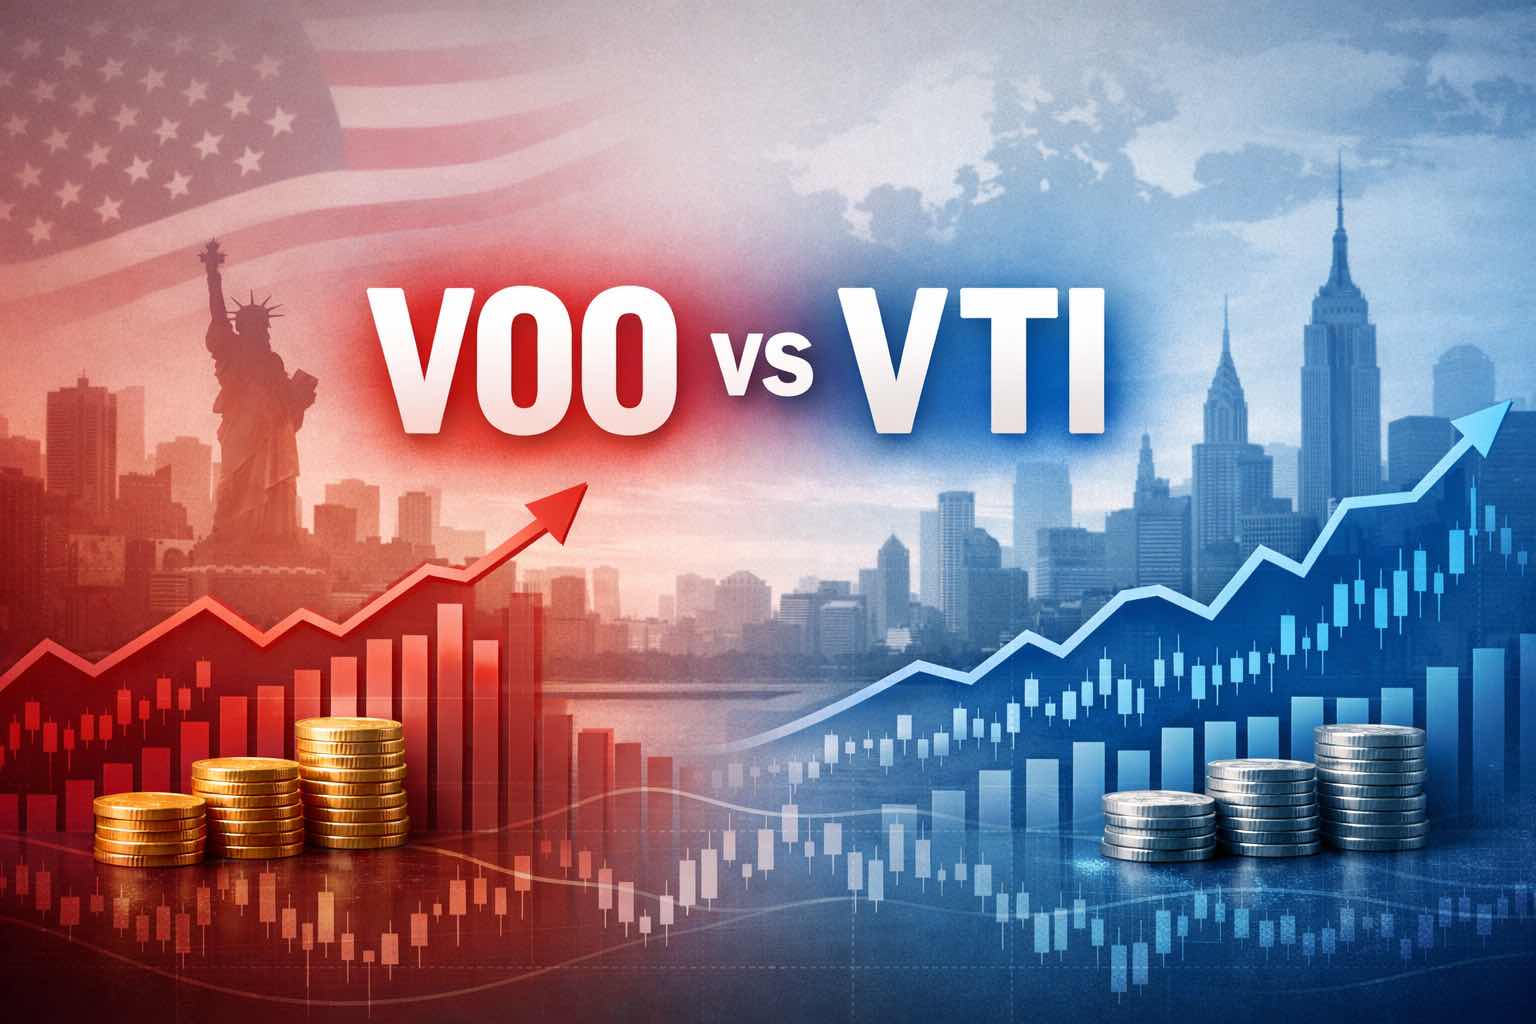
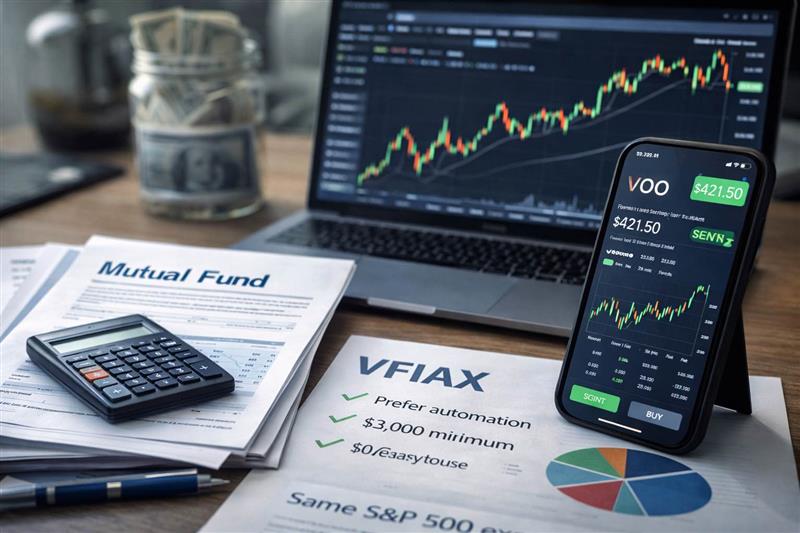
VOO and VTI are central to Vanguard’s low-cost equity offerings, but they serve different purposes. VOO tracks the S&P 500 and focuses on large-cap stocks, while VTI covers the entire U.S. equity market, including large, mid, small, and micro-cap companies. This broader exposure can affect returns during key market cycles.
In 2026, the decision is less about performance and more about your preferred risk exposure. When market leadership is concentrated, and top valuations are high, small and mid caps may help reduce concentration risk or, depending on market conditions, increase volatility.
VOO Is A Large-Cap Bet; VTI Is The Whole U.S. Equity Market In One Fund. The S&P 500 covers roughly 80% of available U.S. market capitalization, so VOO captures most of the market’s value, but it intentionally leaves out the smaller end of the opportunity set.
VTI offers broader exposure, not a different core. As of December 31, 2025, VOO held 504 stocks, while VTI held 3,512. The additional holdings are primarily mid, small, and micro caps, but the largest companies still drive both portfolios.
Concentration is the key difference. At year-end 2025, VOO’s top 10 holdings made up 40.7% of assets, compared to 36.0% for VTI. Both remain top-heavy, though VTI is slightly less concentrated.
Costs are identical. Both funds have a 0.03% expense ratio, so differences in outcomes are driven by index exposure rather than fees.
Risk profiles are similar but not identical. Over the past three years, VOO’s standard deviation was 11.96%, and VTI’s was 12.56%. The slight increase reflects the added exposure to smaller companies.
A Decision Rule:
Choose VOO if you want only large-cap U.S. exposure or prefer to manage small-cap exposure separately.
Choose VTI if you want a single fund that automatically rebalances across all company sizes and do not wish to manage additional allocations.

VOO tracks the S&P 500, a curated large-cap benchmark built around liquidity and investability, with committee oversight and strict index rules. It is designed to represent large U.S. corporations across major industries, and its market-cap weighting makes it inherently momentum-sensitive to whichever mega caps are leading.
VTI tracks the CRSP US Total Market Index, which aims to represent essentially the full investable U.S. equity universe and is engineered to keep turnover low through systematic reconstitution and migration controls.
In practice, VOO filters by size, while VTI does not.
At year-end 2025, VOO’s largest holding was NVIDIA at 7.8%, followed by Apple (6.9%) and Microsoft (6.1%). VTI’s largest holding was also NVIDIA, but at a lower 6.6%, with Apple (6.1%) and Microsoft (5.5%) close behind.
This pattern highlights two key points in the VOO vs. VTI comparison:
Both funds share a mega-cap core. Switching between them does not reduce exposure to large technology companies.
VTI diversifies holdings by including thousands of smaller companies, reducing but not eliminating the dominance of the largest names.
VOO’s sector mix at December 31, 2025, showed Information Technology at 34.4%, Financials 13.4%, Communication Services 10.6%, and Consumer Discretionary 10.4%.
VTI’s sector breakdown for the same date also leaned heavily toward Technology at 38.5%, with Consumer Discretionary at 13.9%, Industrials at 12.1%, and Financials at 11.2%.
Despite classification differences, both funds are growth-oriented when growth stocks dominate market capitalization. Sector weights can shift rapidly when leadership becomes concentrated.
Both ETFs list an expense ratio of 0.03%. Turnover is also low: 2.3% for VOO and 2.1% for VTI (for the most recent fiscal year, as shown in the fact sheets).
Low turnover reduces trading costs and improves tax efficiency, benefiting long-term investors who do not actively time the market.
Both funds distribute dividends quarterly.
As of January 31, 2026, VOO’s 30-day SEC yield was 1.08%.
VTI’s ETF page is less clear in the available data, but the underlying Vanguard Total Stock Market Index Fund share class reported a 30-day SEC yield of 1.07% as of January 31, 2026. This yield typically aligns with the ETF share class, as both represent the same equity income stream.
The main consideration is not the small yield difference, but the income source. Both funds are equity-dividend portfolios, and their distributions will vary with payout policies and market conditions.
For long-term investors, comparing full market cycles is more meaningful than focusing on short-term results. As of December 31, 2025, Vanguard’s fact sheets reported the following average annual total returns:
Metric (As Of December 31, 2025) |
VOO |
VTI |
10-Year Average Annual Return |
14.78% |
14.25% |
5-Year Average Annual Return |
14.38% |
13.08% |
3-Year Average Annual Return |
22.97% |
22.25% |
Since Inception Average Annual Return |
14.82% (since 2010-09-07) |
9.21% (since 2001-05-24) |
Standard Deviation (3-Year Monthly) |
11.96% |
12.56% |
Interpretation:
Recent years have favored large-cap stocks. When a few mega caps outperform, VOO may deliver higher returns due to its greater concentration in these leaders.
VTI provides broader market exposure. While it may not outperform every year, it provides ongoing access to smaller companies, which historically contribute to long-term market growth as they expand into the large-cap segment.
VOO is best suited for investors seeking large-cap exposure. In 2026, this approach is reasonable if you expect scale advantages, global pricing power, and strong balance sheets to drive earnings. VOO also works well for those who combine it with a small-cap or value ETF and prefer to manage factor tilts directly.
VOO also has a straightforward benchmark story: the S&P 500 covers about 80% of U.S. market cap, so it is “broad” in a market-value sense, even if it is not “complete.”
VTI is the preferred choice for investors seeking a comprehensive domestic equity allocation. Its key advantage is automatic internal rebalancing: when smaller companies grow, VTI increases exposure to them, and when they underperform, it reduces that exposure without requiring investor action.
In 2026, that matters because the U.S. equity market is still wrestling with a tug-of-war between capital costs and growth optionality. Smaller firms are typically more sensitive to financing conditions, but they are also where earnings acceleration can first appear as the economy broadens. VTI keeps you exposed to both outcomes without asking you to forecast the turning point.
VTI is more diversified by the number of holdings, with thousands of stocks compared to about 500 in VOO. Both are market-cap-weighted, so mega-caps still drive returns, but VTI slightly reduces concentration risk.
No. Returns depend on the relative performance of large caps versus mid- and small-caps. In periods of narrow mega-cap leadership, VOO can lead. When market breadth improves and smaller companies outperform, VTI can close the gap or lead the market.
Both are low-turnover index ETFs, which supports tax efficiency. Their turnover rate is approximately 2% according to the latest fact sheets, and they pay quarterly dividends. Tax outcomes still depend on your account type and your own realized gains.
VTI is designed for this purpose, covering large-, mid-, small-, and micro-cap stocks in one fund. For a single domestic equity holding with minimal maintenance, VTI is typically the better choice.
Because the S&P 500 represents most of the U.S. market value, and the same mega caps dominate both funds. The difference shows up mainly when small- and mid-cap stocks materially outperform or underperform, or when concentration risk at the top becomes a real drag.
Holding both funds is generally redundant, as VOO is largely represented in VTI. Investors seeking to adjust size exposure often choose VTI alone or pair VOO with an extended-market fund, rather than holding both.
The choice between VOO and VTI is not about which fund is universally better, but about your investment goals. Decide whether you prefer exposure only to large-cap U.S. equities or the entire market. In 2026, with concentrated leadership and shifting valuations, the best option aligns with your risk tolerance and portfolio management approach. For most long-term investors seeking a single core U.S. equity holding, VTI is the default choice. For those seeking targeted large-cap exposure and greater control, VOO is an effective option.
Disclaimer: This material is for general information purposes only and is not intended as (and should not be considered to be) financial, investment or other advice on which reliance should be placed. No opinion given in the material constitutes a recommendation by EBC or the author that any particular investment, security, transaction or investment strategy is suitable for any specific person.
(Vanguard Fund Documents)(Vanguard Fund Documents)(advisors.vanguard.com)