Published on: 2025-05-14
When analysing the U.S. stock market, two major indices often dominate conversations: the S&P 500 and the Dow Jones Completion Index. Both serve as benchmarks for the U.S. equity market, but track vastly different segments.
While the S&P 500 focuses on large-cap companies, the Dow Jones Completion Index includes mid-cap and small-cap companies outside the S&P 500.
In this article, we will explain what each index represents, how they are constructed, their historical performance, and how they can be utilised in portfolio management.

The Dow Jones U.S. Completion Total Stock Market Index, commonly known as the Dow Jones Completion Index, is designed to complement the S&P 500. It includes all U.S. stocks in the Dow Jones U.S. Total Stock Market Index outside the S&P 500.
The Completion Index includes mid-cap, small-cap, and some micro-cap companies. It provides investors with access to U.S. equities beyond the S&P 500, offering a more complete market perspective by addressing the gaps.
This index comprises approximately 4,000 stocks, compared to the S&P 500's 500. It offers a broader exposure to the U.S. economy by including companies with high growth potential that may not yet qualify for the S&P 500.
Despite its coverage, the Dow Jones Completion Index is often less discussed in financial media, but it plays a critical role in total market exposure.

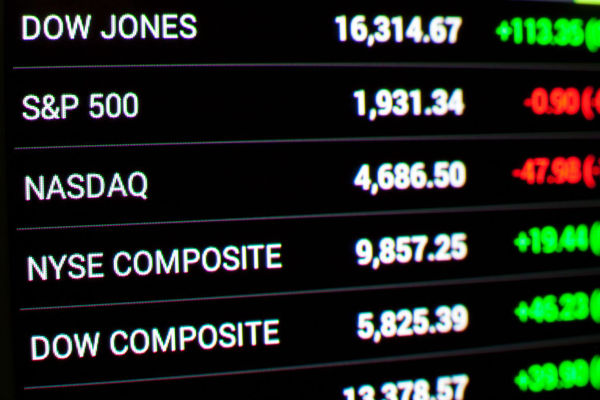
The Standard & Poor's 500 Index, commonly known as the S&P 500, is one of the most widely tracked stock market indices. It comprises 500 of the largest publicly traded companies in the United States and is a benchmark for the overall performance of large-cap U.S. stocks.
These companies span various sectors, including technology, healthcare, financials, and consumer goods. Some of the most recognisable names in the S&P 500 include Apple, Microsoft, Amazon, Alphabet, and JPMorgan Chase.
The S&P 500 is a market-cap-weighted index, meaning companies with higher market capitalisation (share price × number of outstanding shares) have a greater influence on the index's performance. For example, movements in Apple's stock price have a larger impact on the index than movements in a smaller company like Clorox.
S&P Dow Jones Indices managed the index, and its inclusion criteria extend beyond market capitalisation. Companies must also meet standards about liquidity, public float, sector representation, and financial viability.
Although S&P Dow Jones Indices curate both indices, they employ different methodologies and inclusion criteria for their construction.
Dow Jones Completion Index Construction:
Number of Stocks: Roughly 4,000
market cap Range: Excludes S&P 500 constituents, covering mid-cap, small-cap, and micro-cap
Selection Criteria:
Includes all U.S. stocks in the Dow Jones U.S. Total Stock Market Index, not included in the S&P 500
No qualitative earnings filter like the S&P 500
Covers the rest of the investable U.S. market
In essence, the Dow Jones Completion Index plus the S&P 500 equals the total U.S. stock market, making the Completion Index an effective tool for investors aiming for complete market exposure.
S&P 500 Construction:
Number of Stocks: 500
Market Cap Range: Large-cap (companies typically above $14 billion in market cap)
Selection Criteria:
Must be a U.S. company
Market capitalisation above a specific threshold (updated periodically)
Public float of at least 10%
Positive earnings in the most recent quarter and over the prior four quarters combined
Sector representation and other qualitative factors
S&P 500 Funds:
SPDR S&P 500 ETF Trust (SPY)
Vanguard S&P 500 ETF (VOO)
iShares Core S&P 500 ETF (IVV)
Completion index funds:
Vanguard Extended Market ETF (VXF): Tracks the Dow Jones Completion Index.
Fidelity Extended Market Index Fund (FSMAX): Designed to complement S&P 500 holdings.
Schwab U.S. Mid-Cap ETF (SCHM) and Schwab U.S. Small-Cap ETF (SCHA): While not exact Completion Index trackers, they offer similar exposure.
Investors often pair VOO with VXF to create a total market portfolio without overlapping exposure.
| Feature | S&P 500 | Dow Jones Completion Index |
|---|---|---|
| Number of Stocks | 500 | ~4,000 |
| Market Cap Focus | Large-cap | Mid-cap, small-cap, and micro-cap |
| Index Type | Market-cap weighted | Market-cap weighted |
| Purpose | Represents the top large-cap U.S. companies | Represents the rest of the U.S. market not in the S&P 500 |
| Volatility | Lower (more stable) | Higher (more volatile) |
| Growth Potential | Moderate | Higher (especially in bull markets) |
| Institutional Coverage | Extensive | Limited to moderate |
| Liquidity | High | Lower compared to S&P 500 |
| Economic Sensitivity | Less sensitive | More sensitive to economic shifts |
| Typical Use in Portfolios | Core holding for large-cap exposure | Complements S&P 500 for total market exposure |
| Popular ETFs | SPY, VOO, IVV | VXF, FSMAX |
| Expense Ratios (ETFs) | ~0.03% – 0.05% | ~0.04% – 0.08% |
| Management Style | Passive (index-tracking) | Passive (index-tracking) |
| Benchmarking Purpose | Measures large-cap market performance | Fills in gaps to complete total U.S. equity market tracking |
1. Market Cap Exposure
The S&P 500 focuses on large-cap stocks.
The Dow Jones Completion Index focuses on mid-, small-, and micro-cap stocks.
It makes the S&P 500 more stable and mature, while the Completion Index includes more growth-oriented, potentially volatile companies.
2. Number of Constituents
S&P 500: 500 stocks
Dow Jones Completion Index: About 4,000 stocks
The Completion Index is broader and more diverse in company size and industry coverage.
3. Volatility
Large-cap stocks tend to be less volatile due to financial stability and market dominance.
Smaller-cap stocks in the Completion Index are more volatile but may offer higher growth potential.
This means the Completion Index has a higher risk-reward ratio than the S&P 500.
4. Influence on Portfolio Performance
The S&P 500 heavily influences major mutual funds and ETFs.
The Completion Index is often used to complement S&P 500 exposure, especially in total stock market funds like Vanguard's VTSAX or VTI.
5. Liquidity and Analyst Coverage
S&P 500 companies generally enjoy high trading volumes and broad analyst coverage.
Completion Index stocks may suffer from lower liquidity and less institutional attention.
Historical Performance Comparison
Over time, both indices have delivered positive returns, but their performance varies depending on market conditions.
During bull markets, the Completion Index often outperforms due to the high growth rates of smaller companies.
The S&P 500 performs better during bear markets due to its large-cap, stable constituents.
During years of strong economic growth and high investor confidence, small-cap stocks often outperform the market, making the Completion Index stand out. Conversely, in times of uncertainty or recession, investors prefer blue-chip stocks, making the S&P 500 a safer investment option.
This performance divergence highlights the benefit of combining both indices in a diversified portfolio.

Deciding between investing in the S&P 500 and the Dow Jones Completion Index depends on your investment goals, risk tolerance, and time horizon.
Choose the S&P 500 if:
You want low volatility and exposure to well-established companies
You're looking for a core holding in your portfolio
You prefer steady growth with fewer price swings
Choose the Dow Jones Completion Index if:
You seek diversification beyond large-cap stocks
You're interested in higher growth potential
You're building a total market portfolio alongside the S&P 500
For most investors, a blend of both is the most effective way to capture the entire spectrum of U.S. equities.
In conclusion, the S&P 500 and the Dow Jones Completion Index serve different but complementary roles in a well-rounded investment strategy. The S&P 500 exposes investors to the large-cap, blue-chip companies that drive the U.S. economy, while the Dow Jones Completion Index opens the door to small and mid-cap companies with higher growth potential.
By leveraging the strengths of both indices, you can achieve broad diversification, reduce portfolio concentration risk, and enhance your long-term returns.
Disclaimer: This material is for general information purposes only and is not intended as (and should not be considered to be) financial, investment or other advice on which reliance should be placed. No opinion given in the material constitutes a recommendation by EBC or the author that any particular investment, security, transaction or investment strategy is suitable for any specific person.