Published on: 2025-06-09
Updated on: 2026-03-16
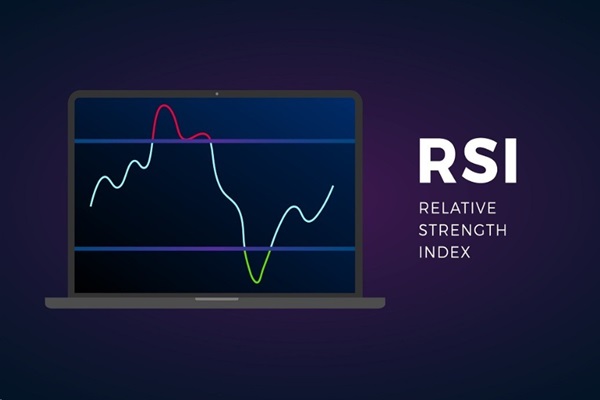
The Relative Strength Index (RSI) is a momentum indicator that helps traders judge whether price is stretched, losing momentum, or confirming a trend.
Used on its own, RSI can produce false signals. Used with market structure, support and resistance, and moving averages, it becomes a practical timing tool.
This article explains a simple RSI trading strategy, how to read the main signals, and how to turn those signals into a repeatable trading process.
The simplest way to use RSI is to treat it as a confirmation tool, not a trigger by itself. Start with the broader market direction, wait for price to reach an important level, then use RSI to confirm whether momentum supports the trade. This keeps the process clear and repeatable.
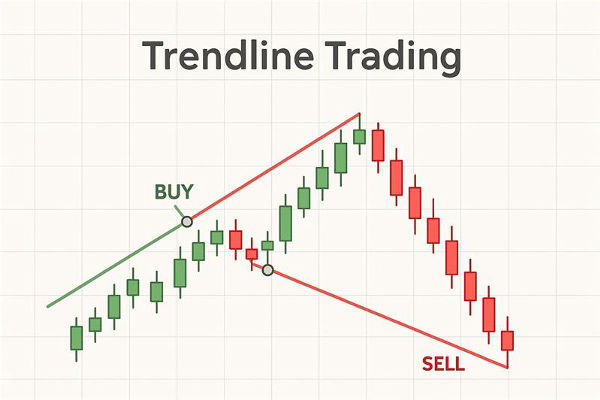
1. Mark the trend first. Use price structure and a key moving average to decide whether the market is trending or ranging.
2. Identify the level that matters. Focus on a clear support, resistance, breakout retest, or pullback zone.
3. Wait for RSI to reach a meaningful area. In ranges, 30 and 70 can matter most. In trends, 40 to 50 or 50 to 60 often matter more.
4. Let price confirm the idea. A rejection candle, break of minor structure, or successful retest is stronger than RSI alone.
5. Define the exit before entry. Set the stop beyond the recent swing and the target at the next logical level so the trade has clear invalidation.
 At its core, the RSI is a bounded oscillator that moves between 0 and 100. The classic thresholds of 70 and 30 help traders identify potential reversal zones.
When the RSI rises above 70. the asset is considered overbought, suggesting a possible pullback or correction.
When the RSI falls below 30. it is seen as oversold, indicating a potential rally or bounce.
In strong trends, overbought can reflect strength and oversold can reflect sustained weakness. A better read is to ask where price is on the chart, what the trend is doing, and whether RSI is confirming or warning against that context.
 One of the most powerful RSI signals is divergence. This occurs when the price action and rsi indicator start moving in opposite directions.
Bullish divergence happens when the price makes lower lows, but RSI forms higher lows. This suggests weakening bearish momentum and a possible upward reversal.
Bearish divergence occurs when price makes higher highs, but RSI forms lower highs. This points to fading bullish strength and a possible drop.
Divergence does not guarantee a reversal, but it can be a useful early warning sign when it appears near support and resistance, a clean Chart Patterns setup, or established trend lines. Treat divergence as an alert first, then wait for price to confirm the setup before entering.
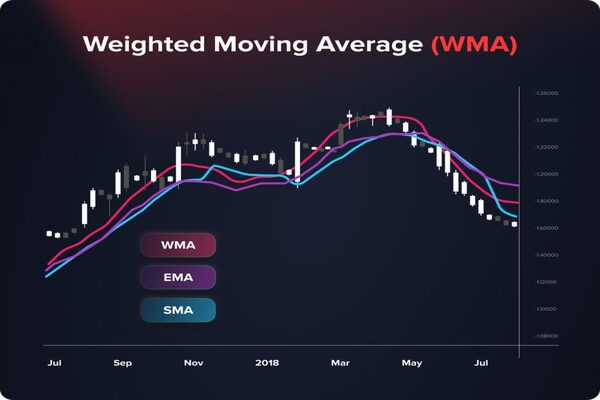
RSI becomes more effective when used alongside other technical indicators. A popular approach is to combine it with moving averages, especially the 50-day and 200-day lines.
Here's how this combo works in practice:
In an uptrend, traders may look for RSI to bounce off the 40–50 zone while price remains above a key moving average. This may signal a pullback within a bullish trend.
In a downtrend, RSI rejection at 50–60 while price is below moving averages could indicate a continuation of bearish momentum.
The goal is not to predict every reversal. It is to trade in the direction of the broader trend and use RSI to time pullbacks or continuation entries with more discipline.
 Support and resistance levels are key areas on a chart where price tends to react. RSI can offer extra confirmation when these levels are tested.
For example:
If RSI shows oversold conditions right as price hits a strong support level, a bounce could be more likely.
If RSI is overbought near a known resistance zone, it may increase the chance of a pullback.
In sideways or range-bound markets, RSI becomes particularly useful. Traders often use it to fade price action—buying near support when RSI is low and selling near resistance when RSI is high.
| Trading style | Common RSI setting | What it does best | Main caution |
|---|---|---|---|
| Scalping / day trading | RSI-5 to RSI-7 | Faster signals for short-term setups | More noise and more false alarms |
| Swing trading | RSI-14 | Balanced speed and reliability | Can still misfire without trend confirmation |
| Position trading | RSI-21 to RSI-30 | Filters more short-term volatility | Slower signals, fewer setups |
| Daily / weekly chart use | Usually RSI-14 or slower | More reliable context for trend and reversal analysis | Fewer signals, wider stop distances may be needed |
Short-term traders, including day traders, may prefer lower RSI settings for faster signals, but that usually means more noise.
Swing traders often stay with RSI-14 because it is easier to manage across 4-hour and daily charts.
Position traders may use slower settings such as RSI-21 or RSI-30 on daily or weekly charts to filter out short-term volatility.
RSI's effectiveness also changes across timeframes. On higher timeframes (e.g. daily or weekly), RSI signals tend to be more reliable, while on shorter charts (e.g. 1-min or 5-min), they are more volatile and should be used cautiously or with confirmation.
Selling just because RSI is above 70, or buying just because it is below 30
Ignoring trend direction, market structure, and key levels
Entering before price confirms, or trading without a clear stop and target
The RSI is simple but powerful—especially when used wisely. It doesn't predict market movements on its own, but it can highlight opportunities and help filter out noise when combined with other tools like moving averages, price structure, and volume.
Traders should always consider the broader trend and be cautious of overreacting to a single RSI reading. Ultimately, the RSI trading strategy rewards those who focus on context, confirmation, and consistency—not just numbers on a screen.
Whether you're new to trading or refining your edge, learning how to use RSI effectively can help you spot high-probability setups and avoid chasing unreliable signals.
Disclaimer: This material is for general information purposes only and is not intended as (and should not be considered to be) financial, investment or other advice on which reliance should be placed. No opinion given in the material constitutes a recommendation by EBC or the author that any particular investment, security, transaction or investment strategy is suitable for any specific person.