Published on: 2026-07-28
Updated on: 2026-07-28
A company can beat earnings estimates, post record profit, and still watch its shares fall within hours. The problem is rarely the profit. It is the cash the business must keep spending to build for the future, and whether that spending has started to pay off. When capital spending runs ahead of the cash those operations produce, the result is negative free cash flow, and that gap between profit and cash is what can make a profitable company a risky investment until the spending proves its return.
Net income is accounting profit; free cash flow is the cash left after capital investment. The two can move in opposite directions.
A profitable company can post negative free cash flow when spending on data centres, factories or other long-term assets outruns the cash its operations generate.
Negative free cash flow is not a warning on its own. It can signal productive investment when real demand supports it, and the new assets are set to earn a return.
The concern grows when capital spending rises faster than revenue and management cannot say when it will lift margins or cash flow.
Compare operating cash flow, capital expenditure and guidance before judging a report, rather than reading earnings per share alone.
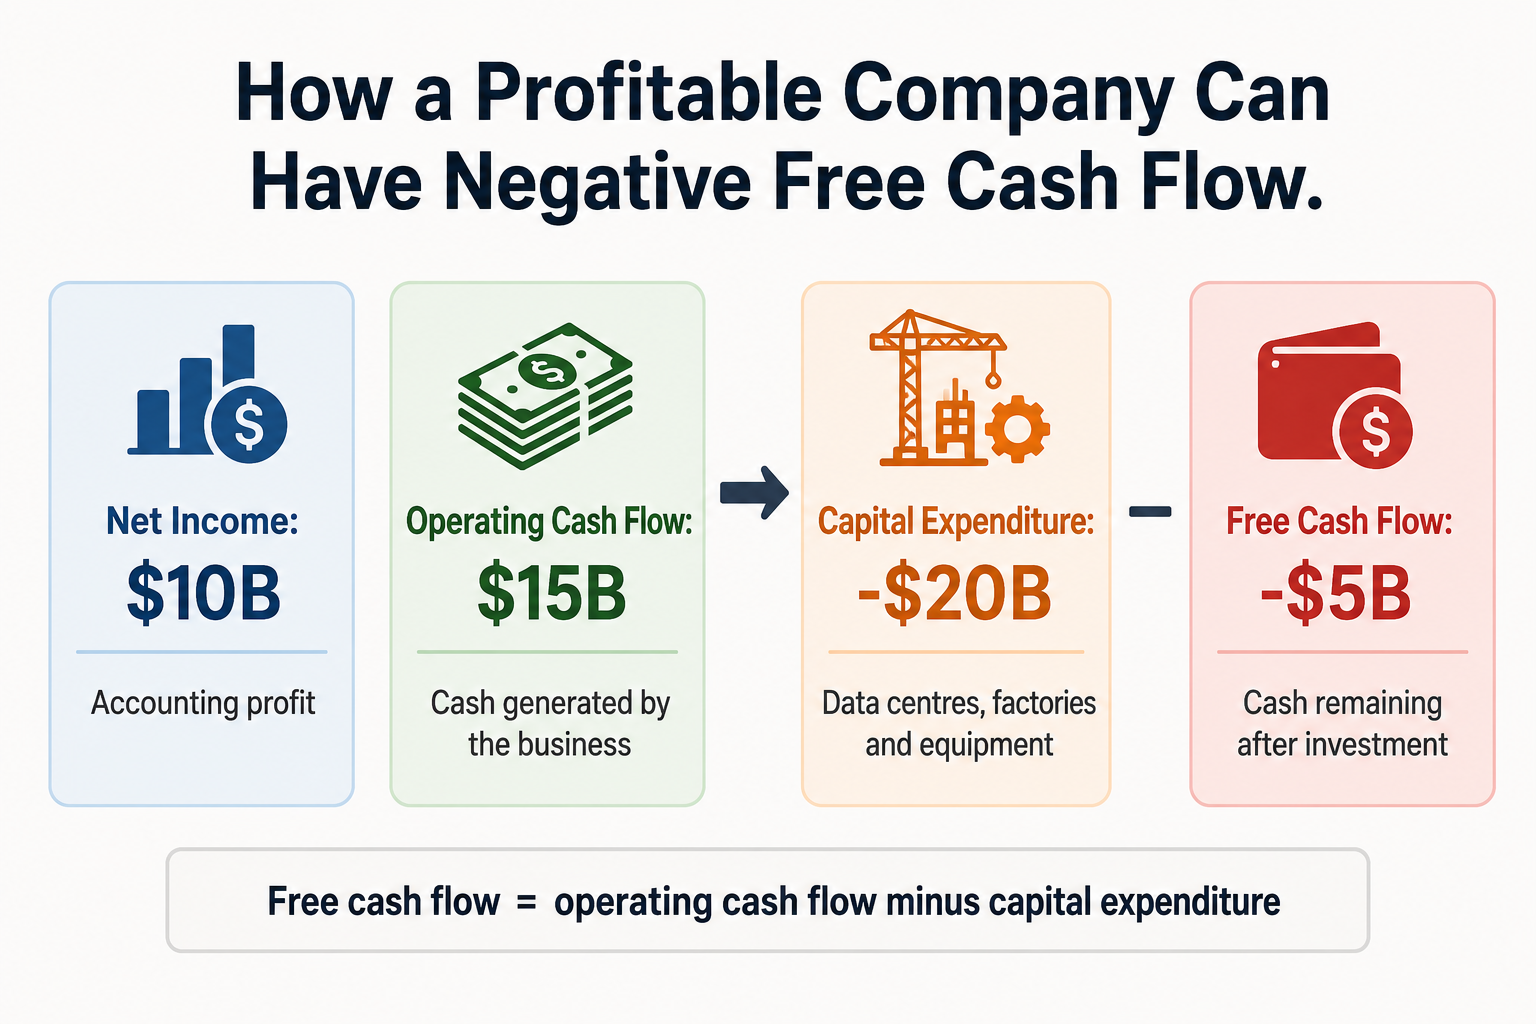
A profitable company can report negative free cash flow because profit and cash are measured differently.
Net income follows accrual accounting: revenue is booked when it is earned and costs when they are incurred, not when the money actually moves. A large asset bought today does not hit profit all at once either. Its cost sits on the balance sheet and is charged against earnings slowly, as depreciation, across the years the asset is used.
The full cash payment, though, can leave the bank in a single quarter. So a company can show a healthy profit while its cash falls, because the money paid for buildings, servers and equipment never passed through the income statement in one go.
Consider a company reporting the following figures:
Measure |
Amount |
Net income |
$10 billion |
Operating cash flow |
$15 billion |
Capital expenditure |
$20 billion |
Free cash flow |
-$5 billion |
The company earned an accounting profit of $10 billion, and its day-to-day operations generated $15 billion in cash. It then spent $20 billion building assets meant to serve the business for years. Subtract that spending from the operating cash, and free cash flow is negative $5 billion for the period.
The business has not failed. It has invested more cash than its operations produced during the quarter. Whether that creates value depends on what the new assets eventually earn.
Negative free cash flow often reflects timing rather than weakness, because companies routinely have to spend before the new revenue arrives.
A chipmaker may build a fabrication plant years before it runs at full output. A retailer may fit out warehouses before it enters a new market. A cloud provider may buy servers and raise data centres before customers use the extra computing capacity. In each case the cash goes out first, and the return follows later.
The spending is easier to justify when:
Customer demand is already visible.
The company is adding capacity that has become constrained.
Revenue from the new assets is starting to appear.
Margins improve as those assets are used more fully.
The balance sheet can carry the investment period.
Management can explain, credibly, how the spending will earn a return.
A single quarter of negative free cash flow rarely settles the question. Large projects do not fit neatly inside three-month reporting periods, and payments for equipment or construction can bunch into one quarter. The pattern tells you far more than any single figure.
High capital expenditure by itself does not prove that management is overinvesting; the warning comes from how the spending compares with what the business is producing.
Capital expenditure rarely tracks revenue quarter to quarter, because infrastructure is built in large stages rather than one server, factory or warehouse at a time. A persistent gap still deserves attention. If spending doubles while revenue grows 10%, more of the company’s value now rests on demand that has not yet arrived.
One useful gauge is the CapEx-to-revenue ratio:
CapEx-to-revenue = capital expenditure ÷ revenue × 100
A company with $20 billion of capital expenditure and $100 billion of revenue has a CapEx-to-revenue ratio of 20%. It put 20 cents into long-term assets for every dollar of revenue it reported in the period. There is no universal good or bad level: a utility, an airline or a chipmaker will normally need far more physical investment than a software company.
The ratio earns its keep in comparison, against:
The company’s own recent quarters.
Its normal historical range.
Its closest competitors.
The revenue and margins the investment later produces.
The number does not tell you whether the spending is wise. It tells you how much of the company’s growth story now depends on future returns from money already committed.
Repeated negative free cash flow is harder to explain away than a single quarter of it. To keep spending, the company must draw down cash, borrow, issue shares or cut spending elsewhere, and the source of that funding becomes part of the analysis.
A firm with a large cash pile and little debt can fund an investment cycle comfortably. A heavily indebted one attempting the same expansion has far less room for a misstep.
Management can always describe the size of a new market; the harder question is what the investment is already earning. The more useful material sits beneath the headline, in disclosures such as:
Capacity utilisation.
Customer commitments.
Revenue produced by the new assets.
Pricing.
Incremental margins.
Expected payback periods.
Future depreciation and running costs.
The cost of a data centre can be measured the moment it is built. Its return takes longer to show up, and reading the company’s earnings guidance is often the only way to gauge when it might. The wider that gap grows, the more investors are being asked to trust a forecast rather than an established cash-flow record.
Alphabet’s second-quarter 2026 results showed a strong business and negative free cash flow at the same time.
Revenue rose 24% to $119.8 billion, and operating income rose 30% to $40.8 billion. Google Cloud revenue grew 82% to $24.8 billion, and the segment’s operating margin widened to 35.6%. None of that describes a company facing collapsing demand. The cash-flow statement told a different story.
Alphabet Q2 2026 |
Amount |
What it showed |
Revenue |
$119.8B |
Strong current growth |
Operating cash flow |
$39.1B |
Core operations generated cash |
Capital expenditure |
$44.9B |
Infrastructure spending exceeded operating cash |
Free cash flow |
-$5.9B |
CapEx absorbed more than the quarter’s operating cash |
Alphabet generated $39.1 billion in operating cash flow but spent $44.9 billion on property and equipment, leaving negative free cash flow of roughly $5.9 billion for the quarter. Its CapEx-to-revenue ratio reached about 37.5%. A year earlier it had spent about $22.4 billion against $96.4 billion of revenue, a ratio of roughly 23.3%. Capital expenditure therefore doubled while revenue grew 24%.
Those figures did not prove the spending was wasteful. Google Cloud was growing fast, its operating margin was improving, and demand for computing capacity stayed strong, so some of the return on the investment was already visible.
The concern lay in the size and length of the commitment. Alphabet raised its expected 2026 capital expenditure to as much as $205 billion and signalled that spending would stay high as it expanded its AI infrastructure. Heavier investment also brings heavier depreciation, energy and data-centre running costs in later periods. To help fund the build-out, Alphabet raised roughly $49.6 billion of new equity in June 2026, one of the funding routes a company turns to when its own operations no longer cover the spending.
Alphabet shares fell around 7% after the report, as investors focused on the rising cost of the expansion cycle rather than the growth. The drop did not mean Google Search or Cloud had stopped working. It meant the report had changed the amount of future cash generation needed to justify the spending.
The company remained profitable and financially strong, and a single quarter’s cash deficit did not put it in danger. What changed was the balance: more of the valuation now sits behind a result that has not yet fully arrived. Current profit can be strong while the cost of producing the next stage of growth climbs faster.
Free cash flow rarely leads an earnings release, so you usually have to find it yourself in the cash-flow statement. Companies open with revenue, adjusted earnings per share and guidance, and place the cash-flow statement several pages back.
Start on the company’s investor-relations website and look for its latest earnings release, quarterly financial tables or Form 10-Q. For a US-listed company, the Form 10-Q is also available through the SEC’s EDGAR database.
Use the document search and enter terms such as “Statement of Cash Flows”, “Cash Flows”, “Operating Activities” or “Property and Equipment”. The cash-flow statement normally sits alongside the income statement and balance sheet in the financial-statements section.
Look for the line Net cash provided by operating activities. It shows the cash produced by normal operations after changes in receivables, inventory, supplier payments and other operating items.
Capital expenditure appears under several names: purchases of property and equipment, additions to property, plant and equipment, capital expenditures, purchases of equipment, or investment in infrastructure. The figure usually sits under investing activities.
Subtract capital expenditure from operating cash flow. A company generating $15 billion in operating cash flow and spending $20 billion on long-term assets has negative $5 billion of free cash flow. Some companies publish their own free-cash-flow measure, but check the definition, because treatment of finance leases, capitalised software and asset sales can differ. Free cash flow is generally a non-GAAP measure, so no single calculation is used identically by every company.
A Form 10-Q may report six-month or nine-month cash flow rather than a standalone quarter. The second-quarter column, for example, may hold the total for the first six months. To isolate the second quarter, subtract the first-quarter figure from the six-month total. Always read the period named at the top of the column before comparing cash flow with quarterly revenue or net income.
An earnings beat tells you results cleared the market’s estimate, and nothing about the quality of those earnings or the spending still to come. A beat can leave the stock lower once investors weigh the cash going out against the profit coming in.
After the headline, check:
Did operating cash flow rise with net income?
Did capital expenditure grow faster than revenue?
Did free cash flow improve or weaken?
Was the change confined to one quarter, or part of a longer trend?
Did management raise its spending forecast?
Are the new assets already producing revenue?
Are margins improving as capacity expands?
Is the company funding the investment internally?
Did debt or share issuance rise?
Does the current valuation already assume the investment will succeed?
Traders may weigh guidance, changes in analyst estimates and the immediate market reaction most heavily. Longer-term investors may focus on whether the spending eventually lifts free cash flow per share. Both are reading the same statements; the difference is how quickly they expect the information to move the stock.
Yes. Profit is an accounting figure, while cash flow tracks money moving in and out. A profitable company can post negative free cash flow if it is investing heavily, building inventory or waiting on customers to pay.
No. It can reflect productive investment in future capacity. It turns concerning when it persists without stronger revenue, better margins or a clearer path to future cash.
No. Free cash flow is the cash generated over a period after capital spending. Cash on the balance sheet is the amount the company holds at a single date.
There is no universal figure, because capital needs vary by industry. Judge it against the company’s own history, its direct competitors and the revenue and margins the spending later produces.
A profitable company is not automatically a good investment for stock investors, and negative free cash flow does not automatically make it a bad one. The judgement sits between those two statements. A company may be investing at exactly the right moment, while demand is strong and capacity is scarce, or it may be committing more cash than future revenue can justify. The financial statements provide the numbers, not the verdict.
Earnings show what the company made. Free cash flow shows how much remained after the business paid to build its future.