Published on: 2025-10-16
Updated on: 2025-10-16

In the realm of technical analysis, few names resonate as profoundly as John Bollinger. An American financial analyst and trader, Bollinger revolutionised the way traders assess market volatility and price action.
In the early 1980s, he introduced Bollinger Bands®, a tool that remains a cornerstone of technical analysis. Bollinger Bands provide traders with a dynamic method to evaluate price levels relative to historical volatility, helping to identify potential overbought or oversold conditions.
The inception of Bollinger Bands can be traced back to Bollinger's quest to enhance the effectiveness of traditional technical indicators. Prior to their development, many indicators relied on fixed parameters, often failing to adapt to changing market conditions. Bollinger sought to create a tool that could adjust dynamically, reflecting the inherent volatility of the market.
By incorporating standard deviations into the analysis, he devised a method that not only captured price trends but also the volatility surrounding them. This innovation led to the creation of Bollinger Bands, which have since become integral to technical analysis.

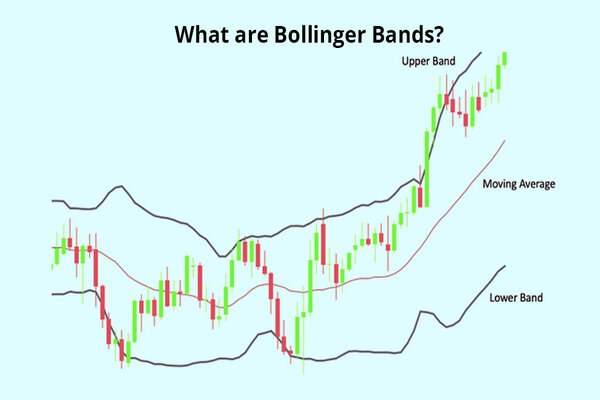
Bollinger Bands consist of three primary components:
Middle Band: A simple moving average (SMA), typically set to a 20-day period, serving as the baseline for price evaluation.
Upper Band: Calculated by adding two standard deviations to the middle band, representing the upper threshold of price movement.
Lower Band: Determined by subtracting two standard deviations from the middle band, indicating the lower boundary of price movement.
These bands adjust themselves based on market volatility. When the market is volatile, the bands widen; conversely, during periods of low volatility, the bands contract. This adaptability makes Bollinger Bands a versatile tool for traders across various markets and timeframes.
The primary objective of Bollinger Bands is to provide a relative definition of high and low prices in the market. By definition, prices are considered high at the upper band and low at the lower band. This relative perspective aids in identifying potential overbought or oversold conditions.
Moreover, Bollinger Bands facilitate the comparison of price action with indicator movements, enabling traders to make informed and profitable trading decisions. This comparative analysis enhances the reliability of trading signals derived from the bands.

Building upon the foundational bands, several advanced indicators have been developed to provide deeper insights into market dynamics:
%B: Measures the position of the last price relative to the bands, indicating whether the price is near the upper, middle, or lower band.
Bandwidth: Quantifies the width between the upper and lower bands, serving as a measure of market volatility.
BBImpulse: Assesses the strength of a trend by evaluating the relationship between price movement and the bands.
These indicators, when used in conjunction with Bollinger Bands, provide traders with a more nuanced understanding of market conditions, enhancing their ability to make informed trading decisions.
Bollinger Bands offer a myriad of practical applications for traders:
Prices near the upper band may indicate overbought conditions, suggesting a potential reversal. Conversely, prices near the lower band may indicate oversold conditions, suggesting a possible upward correction.
A "squeeze" occurs when the bands contract, indicating a period of low volatility. This often precedes significant price movements, providing opportunities to capitalise on potential breakouts.
The direction of price movement relative to the bands can confirm the prevailing trend. Prices consistently touching the upper band suggest an uptrend, while prices near the lower band indicate a downtrend.
Integrating Bollinger Bands with other technical indicators, such as the Relative Strength Index (RSI) or Moving Average Convergence Divergence (MACD), can enhance the accuracy of trading signals.

Beyond his technical innovations, John Bollinger has made significant contributions to trader education:
Overview: This seminal work delves into the intricacies of the bands, offering insights into their construction, application, and interpretation.
Content: The book covers volatility analysis, pattern recognition, and integration with other indicators.
Resources: Provides articles, videos, and tools to assist traders in mastering the bands.
Community: Offers a platform for traders to share experiences, strategies, and insights, promoting continuous learning.

In the contemporary trading landscape, Bollinger Bands continue to be a vital tool:
Adaptability: The bands' dynamic nature allows them to adjust to varying market conditions, making them applicable across different asset classes and timeframes.
Integration with Technology: Modern trading platforms seamlessly integrate Bollinger Bands, enabling use in algorithmic trading and automated strategies.
Global Application: Traders worldwide employ the bands to analyse diverse markets, from equities and commodities to cryptocurrencies, underscoring their universal relevance.
| Limitation | Explanation |
|---|---|
| Lagging | Bands are based on moving averages, which may delay signals |
| False Breakouts | Narrow bands may give misleading signals; confirm with volume or trend indicators |
| Parameter Sensitivity | Effectiveness depends on period and deviation settings; adjust to market |
John Bollinger's creation of Bollinger Bands has profoundly influenced technical analysis. By offering a dynamic tool for assessing market volatility, Bollinger empowered traders to make informed decisions. His work remains highly relevant, underscoring its enduring significance in global markets.
A: John Bollinger is a trader and analyst who invented Bollinger Bands, a widely used technical analysis tool.
A: They are volatility bands above and below a moving average, helping traders identify overbought or oversold conditions.
A: They do not predict trends directly, but help identify potential breakout points and confirm existing trends.
A: Traders use them to spot volatility squeezes, overbought/oversold conditions, and combine with other indicators for confirmation.
A: Yes, they are widely applied to stocks, forex, commodities, and cryptocurrencies.
Disclaimer: This material is for general information purposes only and is not intended as (and should not be considered to be) financial, investment or other advice on which reliance should be placed. No opinion given in the material constitutes a recommendation by EBC or the author that any particular investment, security, transaction or investment strategy is suitable for any specific person.