Published on: 2025-08-27
Updated on: 2025-08-27
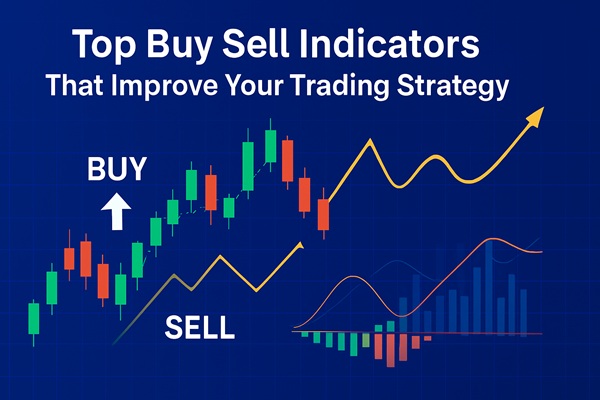
In financial markets, timing is everything. Traders and investors are often confronted with the challenge of deciding when to enter or exit a position, and this is where the buy sell indicator comes into play. These tools, derived from historical price and volume data, are designed to simplify decision-making by signalling potential buying and selling opportunities. Although no indicator is infallible, they provide valuable insights into market sentiment, momentum, and potential turning points.
The following sections examine some of the most widely used buy sell indicators—from oscillators to moving averages—highlighting their strengths, limitations, and how they can be combined for better results.

Momentum oscillators are a cornerstone of technical analysis, offering insights into the speed and strength of price movements.
Relative Strength Index (RSI): Developed by J. Welles Wilder, the RSI oscillates between 0 and 100. Traditionally, values above 70 are considered overbought (possible sell signal), while readings below 30 suggest oversold conditions (possible buy signal). Traders also look for divergences, such as when price makes a new high but RSI fails to confirm, which may indicate weakening momentum and a potential reversal.
Stochastic Oscillator: This tool compares a security's closing price with its price range over a given period. Like the RSI, it uses thresholds (above 80 = overbought, below 20 = oversold). However, the stochastic is especially useful in range-bound markets, signalling turning points within sideways price action.
Both oscillators excel in identifying extremes but should not be used in isolation, as they may generate premature signals in strongly trending markets.

Moving averages remain among the simplest yet most effective buy sell indicators. They smooth out price fluctuations to highlight the underlying trend.
Simple Moving Average (SMA): Calculated as the average closing price over a specific period, such as 50 or 200 days. A rising SMA points to an uptrend, while a declining SMA indicates the opposite.
Exponential Moving Average (EMA): Similar to the SMA, but with more weight given to recent prices, making it quicker to react to changes.
Perhaps the most famous application is the moving average crossover. The Golden Cross occurs when a shorter-term MA (e.g., 50-day) crosses above a longer-term MA (e.g., 200-day), signalling a potential long-term uptrend. Conversely, the Death Cross occurs when the shorter MA falls below the longer one, often interpreted as bearish.
While crossovers are powerful for identifying trend shifts, they can lag during volatile or sideways conditions.

The Moving Average Convergence Divergence (MACD) combines aspects of trend and momentum in a single indicator, making it a versatile tool for buy/sell decisions.
The MACD consists of three components:
MACD line: the difference between two EMAs (typically 12-day and 26-day).
Signal line: a 9-day EMA of the MACD line.
Histogram: the visual representation of the difference between the MACD and the signal line.
Buy signals occur when the MACD line crosses above the signal line, while sell signals appear when it crosses below. Additionally, the zero line (where the MACD shifts from negative to positive) can confirm trend direction. Divergences—when the MACD moves in the opposite direction to price—often hint at weakening momentum and a possible reversal.
MACD is less prone to whipsaws than oscillators, but in sideways markets it may still provide false signals.
Price rarely moves in a straight line. Volatility-based indicators, such as Bollinger Bands and Keltner Channels, help traders visualise price extremes and potential breakout zones.
Bollinger Bands: Created by John Bollinger, this tool plots two bands around a simple moving average, usually set two standard deviations above and below. When price touches the upper band, it may be considered overbought; when it touches the lower band, oversold. However, price can "ride the band" in strong trends, so confirmation with other indicators is advised.
Keltner Channels: Similar in concept but based on the Average True Range (ATR), these channels provide a more stable measure of volatility. A move outside the channel often suggests a continuation of momentum, whereas re-entries can indicate reversals.
By framing price action within dynamic bands, these tools help traders assess whether the market is stretching too far, too fast.
While each buy sell indicator has merit, relying on a single tool is risky. A more robust approach involves combining multiple indicators to filter false signals and enhance accuracy. For instance:
An RSI oversold reading may be more reliable if it coincides with a bullish MACD crossover.
A Golden Cross can be confirmed by increasing trading volume and supportive RSI momentum.
Bollinger Band squeezes, signalling low volatility, can be paired with MACD to anticipate breakout direction.
Equally important is risk management. Indicators are not crystal balls, and false signals are inevitable. Traders should always use stop-loss orders, position sizing, and predefined exit rules to protect capital. As many seasoned investors stress, the key is not predicting every move but surviving long enough to capture the big trends.
The allure of the buy sell indicator lies in its ability to distil complex market dynamics into simple, actionable signals. From oscillators like RSI to trend-based tools like moving averages and volatility measures such as Bollinger Bands, each indicator has its place in a trader's toolkit.
Yet, no single method guarantees success. Market conditions shift, false signals occur, and human psychology often interferes with discipline. The most effective traders recognise this and use indicators as guides—tools to tilt the odds in their favour rather than infallible rules. By combining indicators, applying prudent risk management, and adapting to evolving market conditions, traders can significantly improve their decision-making and long-term results.
In short, the buy sell indicator is best viewed not as a magic formula but as a compass—helpful in navigating markets, but still requiring the skill, discipline, and judgment of the trader holding it.
Q1. What is a buy sell indicator?
A buy sell indicator is a technical tool that highlights potential entry and exit points in the market based on price or volume trends.
Q2. Can I rely on one indicator alone?
No, relying on a single indicator is risky. Combining tools like RSI, MACD, and moving averages improves accuracy and reduces false signals.
Q3. Are buy sell indicators suitable for beginners?
Yes, many indicators are beginner-friendly. However, traders should practise with demos, learn risk management, and avoid over-reliance.
Disclaimer: This material is for general information purposes only and is not intended as (and should not be considered to be) financial, investment or other advice on which reliance should be placed. No opinion given in the material constitutes a recommendation by EBC or the author that any particular investment, security, transaction or investment strategy is suitable for any specific person.