Published on: 2025-09-19
Updated on: 2025-09-19
The Bart Simpson pattern can suggest manipulation in low-liquidity markets, but it may also result from news or natural supply–demand shifts.
Traders should therefore see it as a potential clue rather than conclusive evidence of manipulation.
This article breaks down the Bart Simpson pattern, explaining its structure, causes, trading strategies, and practical risks.
The Bart Simpson pattern shows a sharp spike, sideways consolidation, and an equally sharp reversal.
It is most common in crypto markets but can appear in other speculative assets such as forex or small-cap shares.
Causes include market manipulation, low liquidity, and sudden news or sentiment shocks.
Traders can use it as a visual clue but must combine it with volume, support/resistance, and other indicators.
Over-reliance on the pattern is risky; strict risk management is essential.

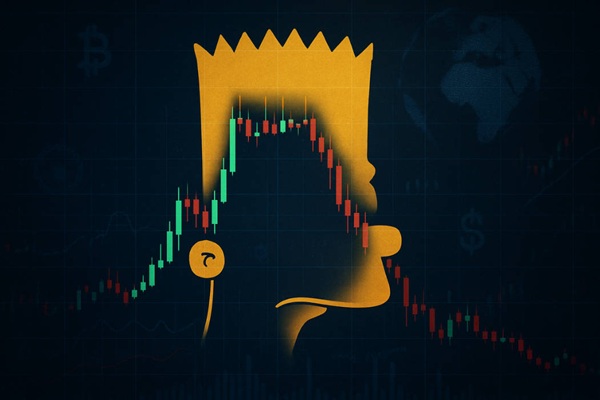
The Bart Simpson pattern is named after the spiky-haired cartoon character. This pattern describes a sudden price surge or drop, followed by a period of sideways consolidation, and finally a sharp reversal that takes the market back to its starting point.
The resemblance to Bart's head is striking: the tall move creates the forehead, the flat top resembles his hair, and the reversal completes the outline.
Although commonly observed in cryptocurrencies such as Bitcoin, the Bart Simpson pattern occasionally appears in other speculative markets like forex and small-cap equities.
The pattern begins with a sudden, steep price movement. This can be an upward surge (pump) or a downward slide (dump). The move is usually rapid, fuelled by a large order or abrupt sentiment change.
Following the spike, prices enter a flat, sideways phase. This consolidation creates the jagged "hair" on the chart. The market seems to pause here, neither advancing further nor retracing, often frustrating traders looking for a trend.
The final stage mirrors the first: the price quickly retraces to the level where the spike began. For bullish Barts, this means a drop after the flat range; for bearish (or inverse) Barts, it means a rebound after the sideways stretch.
Bullish Bart: A downward spike, sideways base, then upward surge.
Bearish Bart: An upward spike, flat top, then sharp fall.
False Bart: When consolidation ends in continuation rather than reversal, trapping over-eager traders.

In thinly traded markets, a handful of large players can trigger sharp moves. By aggressively buying or selling, they generate the initial spike and leave retail traders guessing.
Periods of reduced liquidity create fertile ground for Bart patterns. When few orders exist on the book, sudden trades push the market out of balance, only for it to revert once equilibrium returns.
An unexpected announcement, a regulatory rumour, or even social media hype can cause the abrupt moves typical of a Bart. Emotional reactions—fear, greed, panic—amplify the effect.
Barts are most visible on shorter charts—minutes to a few hours. Longer horizons tend to smooth out the jagged features.
Look for:
A clear spike up or down.
A consolidation plateau with limited volatility.
A return movement approaching the original level.
Volume often confirms the story: a spike in trading during the move, subdued activity during the plateau, then another burst on reversal. Support and resistance zones also help validate whether the final stage is likely.

Some traders attempt to short a bullish Bart at the end of the plateau, expecting the reversal down. Conversely, spotting a bearish Bart may lead them to go long before the recovery spike.
Because false Barts are common, stop-losses are crucial. Placing stops just beyond the consolidation range protects against extended breakouts.
Traders often aim for the price to return to its pre-spike level. Others use Fibonacci levels, moving averages, or nearby support/resistance as guides.
Over-relying on shape alone without confirmation.
Misreading random volatility as a Bart.
Ignoring broader market context.
Bitcoin Bart Spikes: Crypto markets in 2017–2021 repeatedly displayed classic Bart moves, often during thin trading hours or after sudden news.
Inverse Bart in Altcoins: Smaller cryptocurrencies frequently show inverse Barts—sharp drops followed by flat ranges and rapid recoveries—highlighting the volatility of illiquid assets.
These examples underline both the pattern's visual appeal and its unpredictable nature.

What one trader calls a Bart may simply look like noise to another. Pattern recognition is notoriously subjective.
Not all Barts play out fully. Consolidations may break in unexpected directions, making the pattern a risky basis for trades.
The reliability of a Bart depends heavily on market conditions. In highly liquid, orderly markets, the shape is less common and less useful.
Use Confirmation: Combine the Bart with volume analysis, candlestick patterns, or other indicators.
Stay Disciplined: Maintain clear stop-losses and avoid over-sized positions.
Watch Liquidity: Be extra cautious when trading in low-volume markets.
Learn from History: Review past charts to distinguish genuine patterns from misleading spikes.
The Bart Simpson pattern is as entertaining to spot as it is dangerous to misread. Its cartoonish outline offers a light-hearted reference point, but beneath the humour lies a reminder of how unpredictable and manipulated markets can be.
Traders who treat it with caution—balancing observation with confirmation and risk management—can glean useful lessons without being caught off-guard.
Q1: Is the Bart Simpson pattern always bearish?
No. The classic form is bearish, but an inverse Bart can be bullish. The key is whether the initial spike is upwards or downwards.
Q2: On which timeframes is the Bart most common?
It is usually observed on short-term charts—minutes to hours—where sudden price moves are more visible.
Q3: How do I know if a Bart is genuine or just noise?
Look for three distinct parts: the spike, the flat consolidation, and the sharp reversal. Volume confirmation and support/resistance help validate it.
Q4: Can I base my trading solely on the Bart pattern?
No. The Bart is best treated as a visual clue, not a stand-alone signal. Always use other analysis tools and maintain strict risk management.
Disclaimer: This material is for general information purposes only and is not intended as (and should not be considered to be) financial, investment or other advice on which reliance should be placed. No opinion given in the material constitutes a recommendation by EBC or the author that any particular investment, security, transaction or investment strategy is suitable for any specific person.