Get a full breakdown of the Aequs IPO opening in December 2025, including issue size, price band, GMP, financials, risks, and long-term investment outlook.
Learn what Over-the-Counter (OTC) trading means, how the OTC market works, the types of OTC platforms, and the pros and cons of trading non-listed securities.
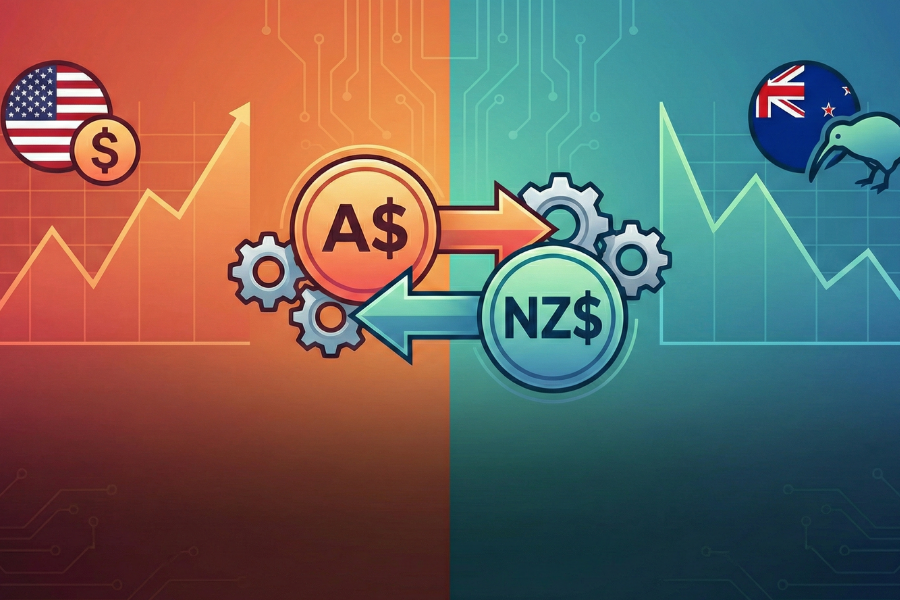
US inflation near 3%, a fresh RBNZ rate cut, and hot Australian CPI are moving AUD and NZD. See what is driving price action, key levels, and what traders are watching next.
SMCI stock has fallen hard from its highs after a weak quarter and guidance concerns. See the latest SMCI price, earnings date, margin risks, and a full RSI / CDMA-style technical table.
Gold above 4,000 dollars an ounce reflects trade wars, sanctions and record central bank gold buying reshaping gold's role in geopolitics and reserves.
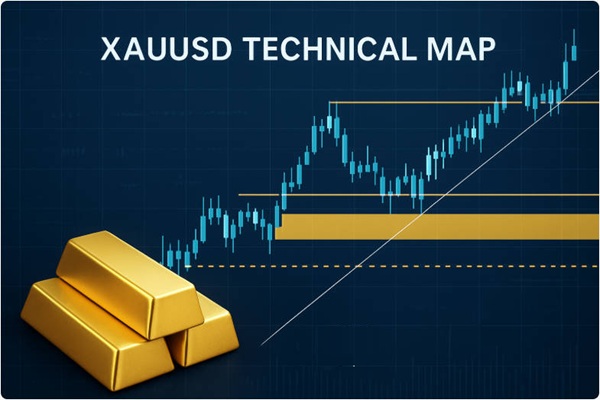
XAUUSD technical analysis for today. See current gold price vs USD, key support and resistance zones, RSI, MACD, moving averages and the trade setups traders are watching now.