Published on: 2025-08-19
Updated on: 2025-08-19
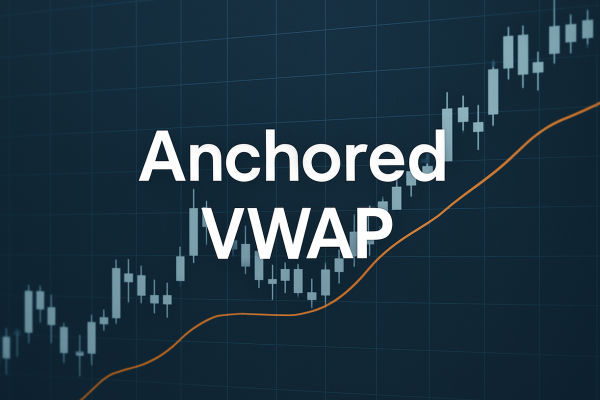
Traders have always searched for ways to cut through the noise of charts and find levels that actually matter. Most indicators simplify market data but often fall short of reflecting where institutional money is positioned. Anchored VWAP—anchored volume-weighted average price—has emerged as one of the more powerful tools to fill that gap. Unlike a moving average or a traditional VWAP that resets daily, anchored VWAP lets traders select a meaningful point in time such as a major breakout, earnings release, or economic event. From that point forward, it calculates the average price weighted by volume, providing insight into whether market participants have been largely profitable or losing since the anchor event.
This makes it more than just another line on the chart. Anchored VWAP helps explain who holds the upper hand in the market, offering a view into whether buyers or sellers are in control. It is especially useful across asset classes—stocks, forex, commodities, and even cryptocurrencies—because it adapts to both short-term traders and long-term investors. Understanding how it works can provide traders with a competitive advantage in spotting support, resistance, and trend conviction.

Anchored VWAP is calculated using the same formula as VWAP, with one crucial difference: the anchor. The formula takes cumulative price multiplied by volume and divides it by cumulative volume. By setting the anchor at a chosen date or event, the line represents the average price market participants have paid since that point, weighted by how much volume traded at each level.
For example, if a trader anchors VWAP to the day of a central bank announcement in forex, the anchored VWAP line shows the average price weighted by volume that traders have paid since the announcement. If price remains above that line, it suggests that most traders who acted on the announcement are in profit, and bullish momentum may have institutional backing. If it falls below, it implies selling pressure and fading conviction.
The real advantage lies in the flexibility of the anchor. Anchoring to the start of the year, the quarter, a support test, or a reversal candle all provide different perspectives. Each anchor captures the market psychology tied to that event.
Anchored VWAP is attractive because it ties technical analysis to real money behaviour. Support and resistance levels are not arbitrary; they are often shaped by where large amounts of money entered the market. Anchored VWAP exposes these levels by showing the true average positioning since an anchor event.
Traders like it for several reasons. It offers clarity by filtering noise, replacing dozens of overlapping moving averages with a single line that reflects actual money flow. It gives confidence in trend continuation, as price respecting anchored VWAP reinforces momentum. And it improves timing by identifying pullback zones that are supported by institutional flows.
For forex traders, anchoring to policy meetings, economic reports, or geopolitical events can reveal how sentiment has developed. For equity traders, anchoring to earnings or IPO dates can show whether institutions have continued to support a stock. For commodity traders, anchoring to major reports such as US oil inventories or OPEC announcements can define fair value.
Imagine a technology stock releasing strong quarterly earnings that push it to new highs. A trader anchors VWAP to the earnings day candle. Over the following weeks, the anchored VWAP line shows whether buyers from that earnings event remain in profit. If the price continues trading above the line, it signals strong institutional support and the likelihood of continuation. If the price falls below, it may indicate profit-taking or waning confidence.
This method is especially useful in markets where news creates defining turning points. In equities, where earnings or product launches can change sentiment overnight, anchored VWAP captures the lasting impact.
Forex traders often face the challenge of interpreting central bank decisions. Anchored VWAP offers a way to measure lasting impact. For example, after the European Central Bank announces a rate decision, a trader can anchor VWAP to that moment on the EUR/USD chart. The line then represents the average weighted price since the announcement.
If the pair trades consistently above anchored VWAP, it implies the market has embraced the decision as euro-positive. If it trades below, it signals bearish positioning. This offers more depth than simply watching the initial spike or dip, as anchored VWAP shows whether the market sustains conviction.
Anchored VWAP becomes particularly powerful when it aligns with other forms of technical analysis. If the line coincides with a horizontal support level, a trend line, or a Fibonacci retracement, that confluence strengthens the level’s significance.
Traders often watch for price to test anchored VWAP during pullbacks. If the market bounces from the line, it confirms buyers are still supporting the move. Conversely, if price rejects anchored VWAP from below, it may act as resistance, confirming bearish sentiment.
By combining anchored VWAP with candlestick patterns or momentum oscillators, traders gain a multidimensional view of the market. It is not about replacing indicators but enhancing them with volume-weighted context.
No indicator is flawless, and anchored VWAP is no exception. Its usefulness depends heavily on choosing the right anchor. Anchoring to irrelevant events produces misleading results. If a trader anchors VWAP randomly without considering fundamental or technical significance, the line may not provide meaningful levels.
Liquidity also plays a role. In thinly traded assets, anchored VWAP can be distorted by low volume, making the line less reliable. Furthermore, while it highlights average positioning, it does not forecast future direction on its own. It should always be paired with broader market analysis.

Anchored VWAP represents a significant evolution in technical analysis. By merging volume and price from meaningful points in time, it transforms charts into maps of institutional behaviour. It shows whether traders are largely winning or losing since a key event, providing a clearer view of who controls the market.
For long-term investors, it offers insight into trend sustainability. For active traders, it sharpens entries and exits, identifies real support and resistance, and validates breakouts. Its strength lies in flexibility, allowing users to anchor it to moments that truly define sentiment.
Disclaimer: This material is for general information purposes only and is not intended as (and should not be considered to be) financial, investment or other advice on which reliance should be placed. No opinion given in the material constitutes a recommendation by EBC or the author that any particular investment, security, transaction or investment strategy is suitable for any specific person.