Published on: 2025-05-05
Updated on: 2025-05-05
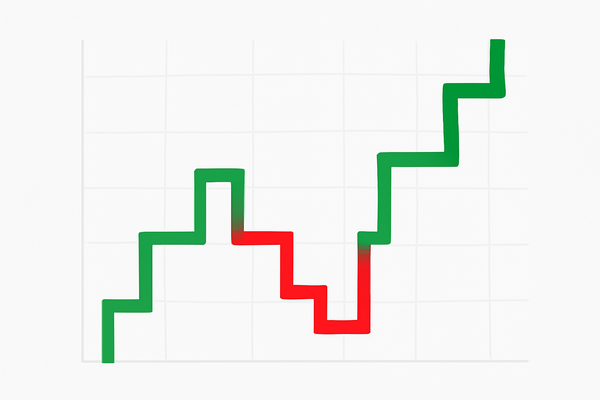
In the fast-moving world of trading, one of the greatest challenges is learning how to filter out noise. Markets are unpredictable, flooded with short-term moves and false signals.
But if you know how to read a spinning top candle, you may have the clarity you've been missing. This subtle yet powerful candlestick pattern has helped traders understand momentum shifts and prepare for potential reversals — without relying on complicated indicators.

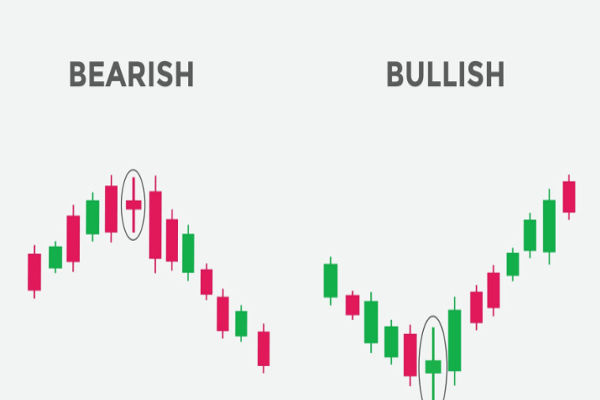
A spinning top candle is a single candlestick pattern that signals indecision in the market. It forms when the opening and closing prices are very close to each other, and the candle has long wicks on both ends. This shape indicates that neither buyers nor sellers had full control during the session, even though both sides tried to move the price.
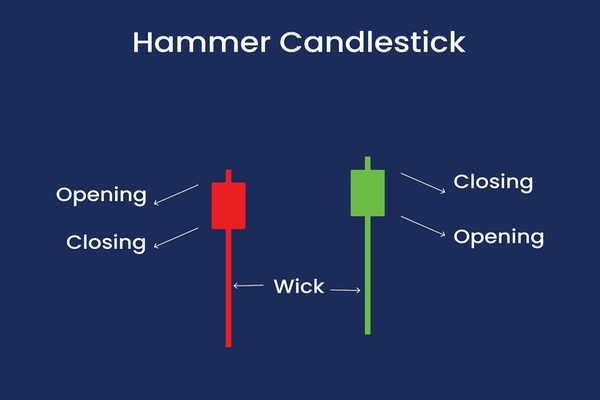
It often shows up after a strong trend, either upward or downward, and serves as a potential warning that the trend is losing steam. Unlike a hammer or a doji, the spinning top candle carries a slightly more neutral tone — but it is the context around it that gives it meaning.
How to Spot a Spinning Top Candle
Look for candles with:
Small bodies (close open and close prices)
Long upper and lower shadows (showing price moved in both directions)
Appears after a noticeable trend
Once identified, the spinning top candle should be analysed alongside volume and surrounding price action. On its own, it does not guarantee a reversal, but in the right setup, it can offer a powerful insight.
The spinning top candle is especially useful during volatile periods when news events or emotional trading drive erratic price movements. While some traders may panic, experienced analysts look for patterns that suggest the storm is settling.
For example, if a stock has been rising for several sessions and a spinning top candle forms on higher-than-average volume, this could be a signal that momentum is slowing. If the next candle confirms a move lower, traders may consider it a valid reversal signal.

Though often confused with the doji, the spinning top candle has distinct traits. While both indicate indecision, a doji has almost no body at all, showing complete balance between buyers and sellers. The spinning top has a slightly larger body, hinting at a mild tilt in control.
Another difference lies in interpretation. A doji might suggest total exhaustion of the current trend, while a spinning top candle often suggests hesitation rather than reversal. Understanding this nuance is key for traders seeking to refine their entries and exits.
Professional traders rarely rely on one signal alone. Instead, they use the spinning top candle as part of a broader technical analysis. It can be used:
To time entries after a trend shows signs of weakness
As a stop-loss trigger when held in open positions
Alongside RSI or MACD to confirm divergences
In combination with support or resistance zones
Patience is key. Wait for the next candle to confirm the sentiment shown by the spinning top. Confirmation can come as a strong move in the opposite direction or a break below (or above) a key price level.
Relying too heavily on a single candle pattern is one of the most common pitfalls. Many novice traders spot a spinning top candle and jump to conclusions. Remember, this candle does not guarantee a reversal. It only suggests that the market is undecided — further signals are needed.
Additionally, context matters. The spinning top candle carries more weight after an extended move. In sideways markets, it may be less useful and could simply reflect ongoing indecision rather than a shift in momentum.
Yes, absolutely. The spinning top candle appears across markets including forex, commodities, stocks and even cryptocurrencies. Its structure is universal and reflects the psychological battle between bulls and bears, regardless of the asset class.
In oil or gold trading, for instance, spotting a spinning top candle at a resistance level after a sharp rally could hint at an incoming correction. Similarly, in currency pairs, it may appear after a news-driven spike, offering traders a chance to reassess their position.
While tempting, the answer is no. The spinning top candle is a piece of the puzzle, not the whole picture. Think of it as an early warning system rather than a trading signal in itself. Pair it with volume analysis, trendlines or momentum indicators for stronger confirmation.
That said, mastering this candlestick pattern can improve your ability to interpret market structure, especially in volatile or emotional trading conditions. It teaches you to slow down, observe and wait for clarity — a mindset that separates the amateurs from the pros.
If you've ever felt overwhelmed by the market's noise, learning to recognise a spinning top candle could bring structure to the chaos. It won't tell you everything, but it will help you pause, reassess and make decisions with greater confidence.
In a market that thrives on speed and reaction, taking a moment to interpret a spinning top might just give you the edge you need.
Disclaimer: This material is for general information purposes only and is not intended as (and should not be considered to be) financial, investment or other advice on which reliance should be placed. No opinion given in the material constitutes a recommendation by EBC or the author that any particular investment, security, transaction or investment strategy is suitable for any specific person.