Published on: 2025-08-22
Updated on: 2025-08-22
Among the many chart formations that traders rely on, the broadening wedge pattern is one of the more distinctive. Unlike symmetrical triangles or flags that contract as they develop, the broadening wedge expands outward, creating a structure where price swings grow wider over time. To retail traders, this often signals an increasingly volatile market environment with growing uncertainty.
Trading the broadening wedge pattern requires careful attention. While it often precedes major breakouts, misreading it can result in significant losses. This article explores the five most important things traders should know about the broadening wedge pattern, providing insights into how to identify, understand, and apply it to trading strategies.

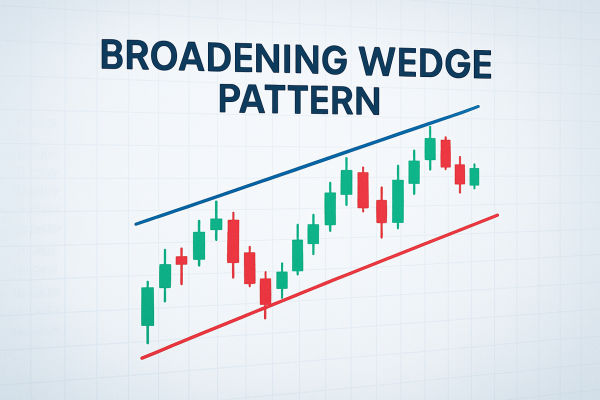
The broadening wedge pattern is identified by two diverging trend lines, one ascending and one descending, which widen as price action develops. Instead of consolidating toward a single point as in a triangle, the market swings become progressively larger.
There are two main variations. An ascending broadening wedge slopes upward, often appearing during bullish moves but warning of potential reversals. A descending broadening wedge slopes downward, generally emerging during bearish trends but often preceding bullish reversals. Regardless of the direction, the key visual cue is the widening range of highs and lows that create the wedge shape.
For retail traders, recognising the structure early is vital. The pattern signals that control between buyers and sellers is becoming less stable, leading to bigger price fluctuations that can set the stage for significant moves.
At its core, the broadening wedge pattern reflects increasing market volatility and indecision. In an ascending broadening wedge, buyers initially push prices higher, but each rally is met with stronger resistance, while sellers also struggle to keep prices contained. The result is expanding swings upward and downward.
This kind of behaviour often signals distribution, where larger players are exiting positions while retail participants continue buying. The growing volatility hints at exhaustion in the prevailing trend. Conversely, a descending broadening wedge suggests growing pressure for a reversal, as sellers dominate but gradually lose strength with each successive low.
Perhaps the most important feature of the broadening wedge pattern is its breakout potential. Because the range expands as the pattern develops, traders anticipate a decisive move once one side finally gains control.
In an ascending broadening wedge, a downside breakout is the more common scenario, as the pattern often forms near market tops. Once price breaks below the lower trend line with strong momentum, traders interpret this as confirmation of a reversal. In a descending broadening wedge, upside breakouts tend to be more frequent, signalling a potential bullish reversal.
However, breakouts are not guaranteed. Sometimes price can continue oscillating within the pattern longer than expected. Traders must therefore use confirmation signals such as high volume, candlestick closes outside the wedge, or confluence with other technical levels before committing to a position.
Trading the broadening wedge pattern can be approached in different ways depending on risk tolerance and time horizon. One strategy involves waiting for a confirmed breakout before entering, thereby reducing the chance of false signals. For example, traders may wait for price to close outside the wedge with high volume before placing a trade in the direction of the breakout.
Others attempt to trade within the wedge itself, capitalising on the expanding swings between support and resistance. This requires precise timing and risk management, as the widening volatility can lead to sudden reversals.
Despite its usefulness, the broadening wedge pattern is not foolproof. Its expanding structure makes it harder to set stop-loss levels, as volatility can trigger premature exits. False breakouts are also common, where price briefly pierces a trend line before snapping back into the pattern.
Another limitation is subjectivity. Not all traders will draw the wedge in the same way, and different time frames may tell conflicting stories. A wedge visible on a one-hour chart may not exist on a daily chart, leading to confusion.
Finally, while the broadening wedge pattern provides clues about potential breakouts, it does not predict direction with certainty. Traders must combine it with risk management, market context, and other analysis tools to improve outcomes.

The broadening wedge pattern is a distinctive formation that reflects market volatility, uncertainty, and potential trend shifts. For retail traders, understanding this pattern is valuable because it often precedes significant breakouts. By recognising the expanding structure, interpreting its psychological meaning, waiting for confirmed signals, and managing risk, traders can incorporate it into their strategies effectively.
However, trading the broadening wedge pattern requires discipline. The widening volatility makes it easy to overextend positions, while false breakouts can trap the unprepared. Like all technical tools, it is best used alongside other forms of analysis rather than in isolation.
For those who take the time to study and practise, the broadening wedge pattern can provide an edge in identifying moments when markets are about to move from indecision into decisive action.
Disclaimer: This material is for general information purposes only and is not intended as (and should not be considered to be) financial, investment or other advice on which reliance should be placed. No opinion given in the material constitutes a recommendation by EBC or the author that any particular investment, security, transaction or investment strategy is suitable for any specific person.