Published on: 2025-06-06
Updated on: 2025-06-06
The bullish kicker pattern is a powerful candlestick formation that often signals a dramatic reversal in market sentiment. Traders who can spot it early gain a potential edge, as it frequently marks the beginning of a strong upward price move. Recognising this pattern means understanding not just the candles themselves but also the psychology behind the price action.
When the bullish kicker pattern appears, it suggests that bearish momentum has not just slowed but been completely overtaken by bullish demand. The speed and decisiveness of this reversal make it one of the most reliable signals for traders who rely on price action to guide their decisions.

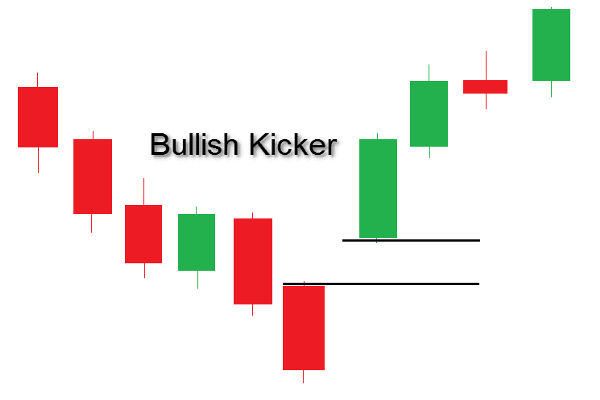
To identify a bullish kicker pattern, the first sign is a strong bearish candle. This initial candle reflects a market dominated by sellers, where the close is significantly lower than the open. It sets the stage by confirming ongoing downward pressure.
The critical second sign is what happens next. The following trading session opens not near the previous close, but at or above the first candle's open, often leaving a noticeable price gap. What follows is a large bullish candle that moves decisively upwards with little to no lower shadow. This shows an immediate and overwhelming shift in sentiment, with buyers taking full control.
There is rarely any overlap between the two candles. This gap between the bearish and bullish candles forms the backbone of the bullish kicker pattern, making it visually distinct and emotionally impactful.
One of the most important signs that a bullish kicker pattern is forming is the appearance of a price gap between the first candle's close and the second candle's open. This gap is not caused by random volatility but usually triggered by a news event, earnings release or a sentiment shift after market hours.
This gap reflects traders' unwillingness to continue selling. It shows that buyers are ready to pay higher prices without hesitation, indicating urgency and conviction. The presence of a wide gap is often what sets the bullish kicker pattern apart from other reversal signals.
While the bullish kicker pattern can appear without high volume, experienced traders often look for strong volume accompanying the second bullish candle. When volume surges as the bullish candle forms, it provides additional confirmation that the market genuinely supports the reversal.
High volume indicates that institutional traders or a broad base of investors are participating in the move, which reduces the chances that the signal is false or temporary. So, while not strictly required, volume is one of the supporting signs that gives extra weight to a bullish kicker pattern.
A bullish kicker pattern holds more significance when it appears after a well-established downtrend. In this context, the pattern signals a potential shift in trend direction, not just a short-term bounce.
If the market has been drifting lower over several sessions or weeks, and suddenly prints a bullish kicker pattern, it suggests the downtrend may be over or at least paused. This is because such a sharp change in candle structure and sentiment rarely occurs without a meaningful reason.
That is why traders often wait for this pattern to show up in areas of oversold conditions or after consistent bearish activity. In these moments, the signal has greater reliability.
The true power of the bullish kicker pattern lies in its psychological impact. The sudden shift from a bearish candle to a bullish one, separated by a price gap, represents a complete rejection of the previous sentiment.
Traders who were short may rush to cover their positions, fuelling additional upward momentum. At the same time, new buyers enter the market with confidence, encouraged by the forceful nature of the move. This mix of panic and optimism often accelerates the trend reversal.
Understanding this emotional context is as important as recognising the technical elements. It is what transforms the bullish kicker pattern from a mere shape on a chart to a signal backed by behavioural logic.
Although relatively rare, the bullish kicker pattern tends to appear around key news events, earnings announcements, and after prolonged periods of uncertainty. It is during these moments that sentiment can shift quickly and decisively.
Some traders even monitor high-impact economic calendar events in anticipation of such setups. If markets have been trending lower before an announcement, and the result exceeds expectations, a bullish kicker pattern can emerge as markets rapidly adjust their outlook.
Because of this, traders who want to spot the pattern in real time often combine candlestick analysis with awareness of macroeconomic catalysts.

While the bullish kicker pattern is considered highly reliable, no pattern is infallible. Sometimes, a sudden bullish candle with a price gap can result from short-term speculation, only to fade within a few sessions.
The best way to avoid false signals is by waiting for confirmation. This might include a continuation candle in the same direction, strong volume, or support from a technical level like a moving average or a trendline. Without confirmation, the pattern may turn into what is known as a “bull trap,” drawing traders in before reversing.
Therefore, while spotting a bullish kicker pattern is an excellent start, pairing it with other technical signals or filters enhances decision-making.
The bullish kicker pattern is a standout among reversal signals for good reason. Its ability to mark sharp, sudden changes in sentiment makes it a favourite of price-action traders and technical analysts alike. Though rare, when this pattern appears after a downtrend with strong supporting signs such as volume and price gap, it is often a sign of major directional change.
By learning to spot the top signs of a bullish kicker pattern forming, traders can better position themselves to act on meaningful opportunities. Like all tools, it should be used in context, but when applied correctly, it adds significant value to any technical trading strategy.
Disclaimer: This material is for general information purposes only and is not intended as (and should not be considered to be) financial, investment or other advice on which reliance should be placed. No opinion given in the material constitutes a recommendation by EBC or the author that any particular investment, security, transaction or investment strategy is suitable for any specific person.