Published on: 2025-07-02
Updated on: 2025-07-02
The ATR Indicator (Average True Range) is one of the most widely used tools in technical analysis, helping traders assess market volatility. Developed by J. Welles Wilder, the ATR provides crucial insights into the degree of price movement in a given asset, allowing traders to make more informed decisions.
Unlike many indicators that help predict the direction of price movement, the ATR focuses solely on volatility, which is an essential element of successful trading strategies.
Whether you're a beginner or an experienced trader, understanding how the ATR Indicator works can significantly improve your ability to navigate different market conditions and manage risk effectively.

The ATR Indicator calculates the average range between the highest and lowest price levels of an asset over a defined period, usually 14 days. The value of the ATR reflects the average amount the price moves during this period, and it is calculated using the “True Range” of each candlestick.
The True Range is determined by considering three factors: the current high minus the current low, the absolute value of the current high minus the previous close, and the absolute value of the current low minus the previous close.
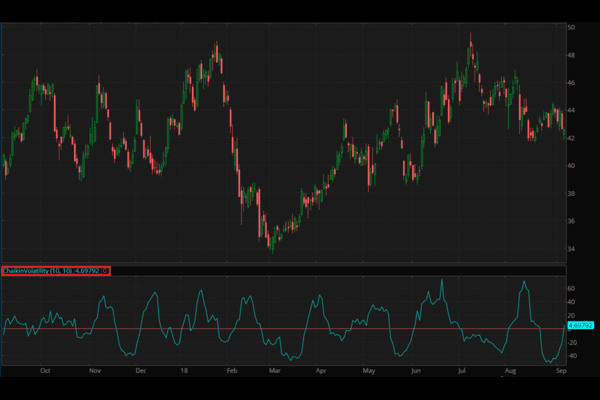
The ATR Indicator is often plotted on a separate chart below the price chart and displayed as a single line representing volatility. Higher ATR values signify greater price movement, while lower values indicate lower volatility. Traders use this information to make decisions about where to place stops, position sizes, and how to manage their risk.

The ATR Indicator is primarily used to gauge volatility, but it has several practical applications for traders. One of the most popular uses of the ATR Indicator is for determining where to place stop-loss orders. Since the ATR indicates how much an asset typically moves, traders can use it to set stop-loss levels that account for the asset's volatility.
For instance, if the ATR is 2, a trader might place a stop-loss 2 points away from the entry point, ensuring that normal price fluctuations don't prematurely hit the stop. By adjusting stop-loss levels based on the ATR, traders can avoid getting stopped out due to everyday market noise, especially when trading in volatile conditions. The ATR helps in setting realistic stop levels that accommodate the typical price movement of an asset.
The ATR Indicator is also crucial for position sizing. In volatile markets, it's important to reduce the size of your position to limit risk. A higher ATR means larger price movements, and to maintain consistent risk per trade, traders might reduce their position size when volatility is high.
Using the ATR to calculate position size helps ensure that traders are not overexposing themselves to risk in markets with higher volatility. For instance, if a trader wants to risk a fixed percentage of their capital (e.g., 1% of their account) on each trade, they can use the ATR to determine how much of the asset to buy or sell based on the distance of their stop-loss from the entry point.
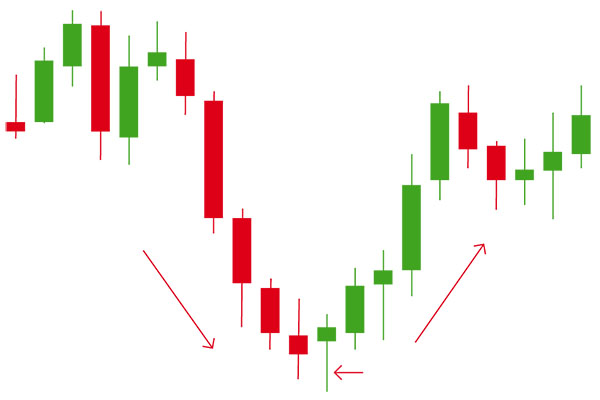
The ATR Indicator can also be used to identify breakout potential. A rising ATR, particularly when accompanied by a price breakout from a consolidation phase, indicates increasing volatility. This surge in volatility may signal that the market is preparing for a significant price move.

The ATR Indicator offers several key advantages. It provides reliable insight into volatility, which is an essential factor in successful trading. By understanding how much an asset moves on average, traders can adjust their strategies to better fit market conditions.
The ATR automatically adjusts to changes in volatility, making it useful in both trending and range-bound markets. It helps traders stay flexible and adapt to varying market conditions. The ATR also offers a clear method for managing risk. By using it to set stop-loss levels and determine position sizes, traders can protect themselves from adverse price movements and avoid overexposing their portfolios.
Although the ATR doesn't indicate price direction, it works well in conjunction with other indicators. Traders often combine the ATR with trend-following tools, like moving averages or the RSI, to refine their strategy and filter out false signals.
While the ATR Indicator is a useful tool, it does have some limitations. Most importantly, the ATR does not provide any directional information. It only measures volatility and does not predict whether the price will move up or down. Therefore, it needs to be used alongside other indicators to gain a clearer view of the market.
Another limitation is that the ATR is a lagging indicator, as it relies on past price data to calculate volatility. This means that the ATR may not always be quick to react to sudden changes in market conditions, such as geopolitical events or major news releases.
Finally, the ATR is only useful for understanding volatility; it does not give any insight into the underlying fundamentals of an asset. Therefore, traders should use it as part of a broader analysis that includes fundamental data.
The ATR Indicator is an essential tool for traders looking to measure volatility and manage risk. It helps traders determine appropriate stop-loss levels, adjust position sizes, and evaluate market conditions. Although the ATR is not a directional indicator, it complements other technical tools by providing a clearer picture of market dynamics.
By incorporating the ATR Indicator into your trading strategy, you can better navigate volatile markets, reduce the risk of premature stop-outs, and make more informed decisions. Whether you are a day trader, swing trader, or long-term investor, understanding the ATR can help you adapt to changing market conditions and improve your overall trading performance.
Disclaimer: This material is for general information purposes only and is not intended as (and should not be considered to be) financial, investment, or other advice on which reliance should be placed. No opinion given in the material constitutes a recommendation by EBC or the author that any particular investment, security, transaction, or investment strategy is suitable for any specific person.