Published on: 2025-07-31
In the realm of candlestick analysis, few patterns speak as clearly about market momentum as the Tasuki Gap. Whether you are a seasoned trader or just beginning to explore price action, understanding this lesser-known yet powerful pattern can refine your strategy and improve your timing. This article delves deep into the Tasuki Gap—its formation, psychological underpinnings, and practical trading applications.

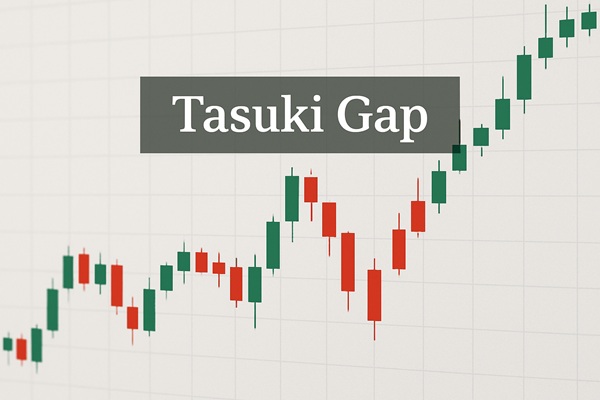
The Tasuki Gap is a three-candle continuation pattern that signals the likely continuation of an existing trend—either upward or downward. Originating from Japanese candlestick analysis, the pattern comes in two forms:
Bullish Tasuki Gap (Upside): Occurs during an uptrend. The first two candles are strong bullish candles separated by an upward gap. The third candle is bearish and partially retraces into the gap, but does not fill it entirely.
Bearish Tasuki Gap (Downside): Appears in a downtrend. Two strong bearish candles form a downward gap, followed by a bullish candle that retraces into—but doesn't fully close—the gap.
Unlike reversal patterns that suggest a change in direction, the Tasuki Gap emphasises trend persistence and reflects a momentary pause before the dominant force resumes control.
To reliably identify a Tasuki Gap, traders should look for the following characteristics:
Bullish Tasuki Gap:
Candle 1: A long white (bullish) candlestick continuing the prevailing uptrend.
Candle 2: Another bullish candle that opens with a gap up and closes higher.
Candle 3: A bearish candle that opens within the body of Candle 2 and closes within the gap—but crucially, does not fill the gap created between Candle 1 and 2.

Bearish Tasuki Gap:
Candle 1: A long black (bearish) candlestick in line with a prevailing downtrend.
Candle 2: Another bearish candle that gaps down and closes lower.
Candle 3: A bullish candle that opens within the body of Candle 2 and closes within the downward gap—without filling it entirely.

General Rules:
The third candle acts as a temporary pullback or hesitation.
The gap must remain partially open—a full fill invalidates the pattern.
Volume is often higher during the gap candle, suggesting increased market conviction.
Understanding the psychology behind the Tasuki Gap provides context for its reliability.
In a bullish Tasuki Gap, the market is experiencing strong upward momentum. The first two candles—with the gap between them—indicate aggressive buying. The third candle, which is bearish, reflects short-term profit-taking or a brief challenge from sellers. However, the failure to fill the gap entirely shows that buyers remain confident, and demand is still dominant.
In a bearish Tasuki Gap, sellers have control. The first two bearish candles (with a gap down) reflect strong selling pressure. The bullish third candle represents a minor bounce or relief rally, but it lacks the strength to reclaim lost ground. This signals that bearish momentum is still intact.
In both cases, the incomplete gap fill is crucial—it symbolises resilience in the prevailing trend and gives traders a window into collective market sentiment.

Entry Strategy:
Enter the trade in the direction of the original trend after the close of the third candle, preferably when price action resumes movement in the direction of the gap.
Some traders wait for a fourth candle as confirmation.
Stop-Loss Placement:
Place a stop-loss just beyond the third candle’s high (in bearish setups) or low (in bullish setups).
Alternatively, use a technical level such as the edge of the gap.
Target Setting:
Targets can be placed using measured moves, assuming the trend will continue the same distance as the original price leg before the gap.
Fibonacci extensions, previous swing highs/lows, or trend-based support/resistance zones can also help define exits.
Indicator Confluence:
Use tools like:
Volume indicators to confirm the strength of the gap
Moving averages to ensure trend alignment
RSI or MACD to avoid entering during overextended conditions
This multi-layered approach increases the reliability of the setup and minimises false signals.
While the Tasuki Gap can be a powerful pattern, it comes with pitfalls:
Mistaking other gap formations (such as breakaway or exhaustion gaps) for Tasuki Gaps.
Trading in sideways or weak trends, where the pattern loses significance.
Overlooking volume—a low-volume gap may lack conviction and be more likely to reverse.
Expecting reversals—the Tasuki Gap is not a reversal pattern. It signals continuation and should be used accordingly.
To avoid these errors:
Always verify trend strength before trading.
Avoid trading Tasuki Gaps in isolation—look for confluence with broader market structure.
Use consistent risk management—no pattern is 100% reliable.
Chart Examples:
On a Tesla daily chart, a Bullish Tasuki Gap occurred in mid-2023. signalling a continuation that led to a further 15% rally.
On EUR/USD 4H timeframe, a Bearish Tasuki Gap in early 2024 preceded a sharp 80-pip drop.
Pattern Performance:
Studies suggest Tasuki Gaps work best in strong trending markets, particularly in equities and indices.
According to Bulkowski's candlestick performance ranking, continuation patterns like the Tasuki Gap have above-average success rates when filtered with trend strength and volume.
Comparison with Similar Patterns:
Breakaway Gap: Usually larger and occurs at the start of a trend.
Side-by-Side White Lines: Also a continuation, but with two nearly identical bullish candles.
Tasuki Gap stands out due to the presence of a retracement candle that tests the gap's integrity.
The Tasuki Gap may not be the most well-known pattern in candlestick trading, but it offers high value when identified correctly in trending markets. It reflects a moment of hesitation that fails to reverse the dominant force, reinforcing trend strength and offering a tactical entry point. With proper context, indicator support, and disciplined execution, traders can integrate the Tasuki Gap into a broader strategy to ride momentum with confidence.
Disclaimer: This material is for general information purposes only and is not intended as (and should not be considered to be) financial, investment or other advice on which reliance should be placed. No opinion given in the material constitutes a recommendation by EBC or the author that any particular investment, security, transaction or investment strategy is suitable for any specific person.