Published on: 2026-07-27
Updated on: 2026-07-27
An earnings report is the quarterly disclosure in which a listed company sets out its revenue, profit and outlook, and it can show rising earnings per share (EPS) while the business underneath weakens: guidance cut, margins squeezed, or growth bought with heavy spending. All you need is seven checks and roughly 10 minutes to tell you the two things the headline will not: whether the business actually improved, and whether the result cleared the expectations already priced into the shares.
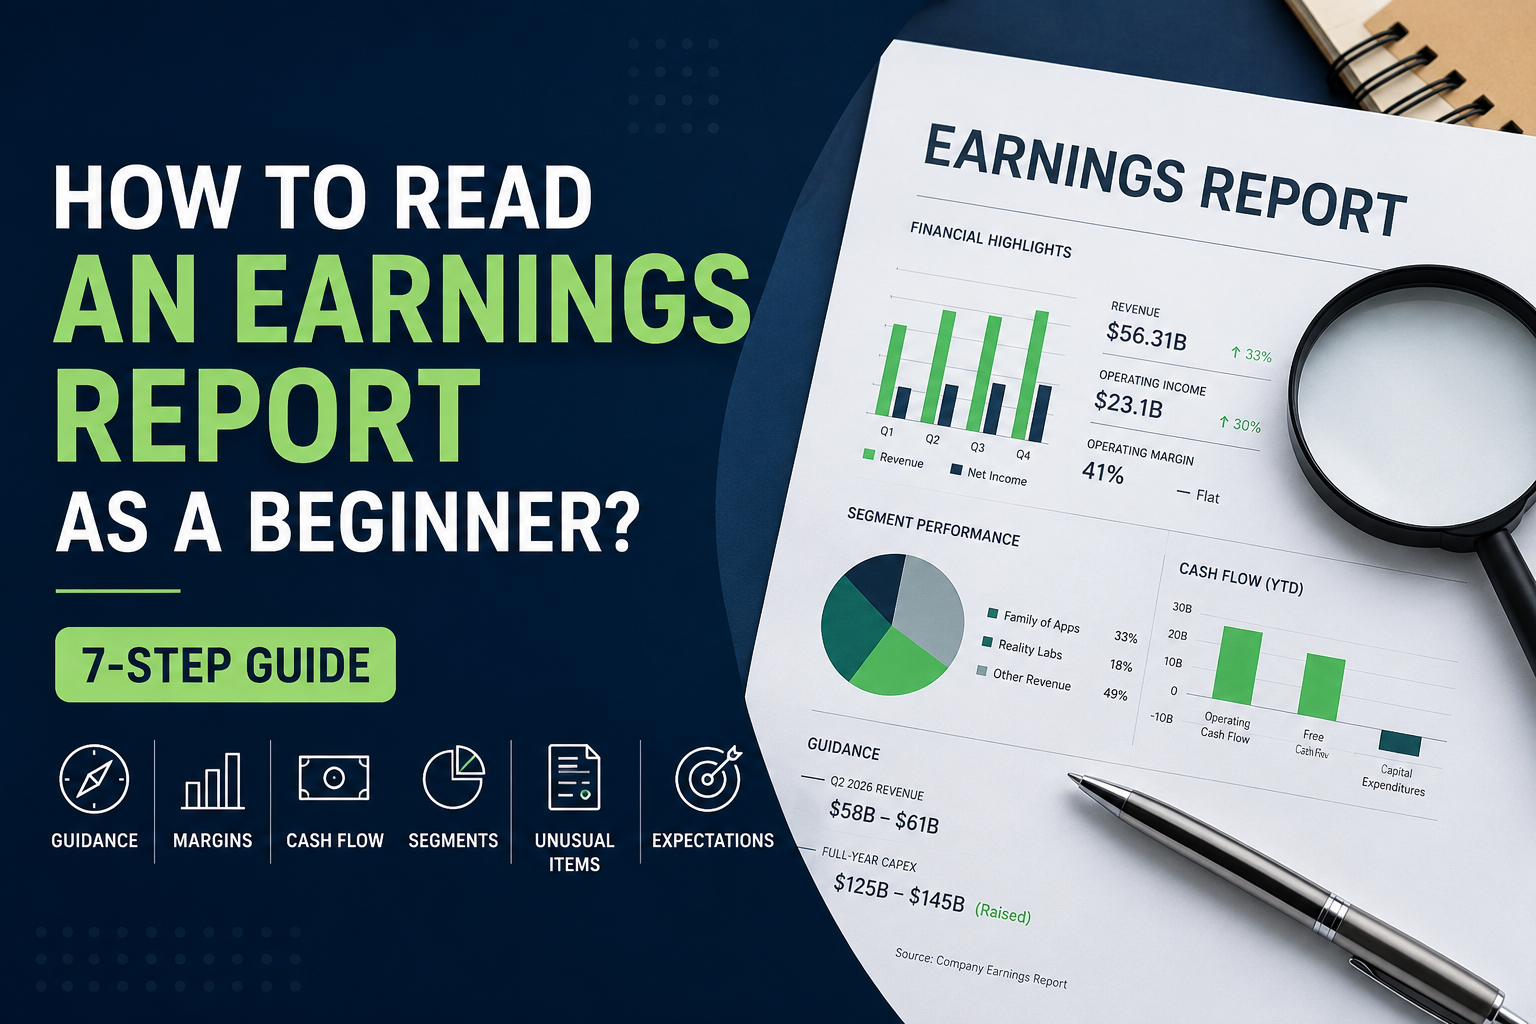
Start with guidance. Guidance is where management shows how it expects revenue, margins and profit to develop, and it moves valuations more than the quarter just reported.
Set revenue growth against cost growth. Rising sales only help if operating profit rises with them; when costs climb faster, each extra dollar of revenue earns less.
Check cash flow against net income. Reported profit and cash can diverge, so a rising profit that is not turning into cash is worth a second look.
Find the segment driving growth. A strong company-wide number can rest on one division while others weaken.
Read the unusual items. Tax benefits, investment gains and recurring “one-time” adjustments can lift headline EPS without improving the core business.
Measure the result against expectations. A company can beat analyst estimates and still disappoint if the price already assumed more.
An earnings report should not be read from the first page to the last. Assign each of your 10 minutes to one question and work through the report in a fixed order, headline first, footnotes last.
| Check | Main question |
|---|---|
| Guidance | Did management raise or cut the outlook? |
| Revenue and margins | Did higher sales produce more operating profit? |
| Cash flow | Did reported profit turn into cash? |
| Business segments | Which division produced the growth? |
| Unusual items | Did anything distort EPS? |
| Expectations | Was the result better than the market expected? |
| Market reaction | What changed once management explained the results? |
For the source documents, use the company’s investor-relations page or the SEC’s EDGAR database rather than a news summary. The Form 8-K usually carries the earnings report itself, while the Form 10-Q holds the financial statements, footnotes and management discussion behind the headline figures.
Guidance is management’s own forecast for revenue, margins, costs and capital spending over the quarters ahead, and it is the first thing to read. A share price is the market’s estimate of a company’s future cash flow, so management’s guidance, not the quarter already banked, is what resets the numbers analysts feed into their models. That is why a company can beat on the completed quarter and still lose value when it lowers the path ahead.
Read the new outlook against four reference points:
The guidance issued last quarter
Current analyst estimates
The company’s own recent growth rate
Management’s assumptions about demand and costs
Meta shows the split cleanly. Its Q1 2026 revenue rose 33% to $56.31 billion, and management guided Q2 revenue to between $58 billion and $61 billion. It also lifted full-year capital-expenditure guidance, from a $115 billion to $135 billion range up to a $125 billion to $145 billion range.
The larger spending plan raised a second question that the revenue line could not answer: how much future revenue and cash flow that capital eventually has to generate.
Operating margin is operating income divided by revenue, and it shows how much profit a company keeps from each dollar of sales. Revenue tells you whether customers are buying more; the margin tells you whether that demand is reaching the bottom line.
| Line | What it shows | Warning sign |
|---|---|---|
| Revenue | Demand and sales growth | Growth is slowing |
| Operating margin | Profit kept per sales dollar | Costs rise faster than revenue |
| Operating income | Profit from core operations | Revenue grows while profit falls |
Read the direction of all three together. Ideally, revenue, operating income and operating margin improve at once.
Meta grew without gaining efficiency. Q1 revenue rose 33%, while total costs and expenses rose 35%. Operating income increased 30%, and operating margin held unchanged at 41%. The company expanded quickly without earning more on each dollar it took in.
American Airlines shows a harsher squeeze. Q2 revenue rose 16.3% to a record $16.7 billion, yet higher fuel costs absorbed most of the gain and left GAAP net income at $71 million. Record revenue described customer demand accurately. It said nothing about how little profit survived the cost base.
The test is simple: is revenue rising faster than costs? When expenses outrun sales quarter after quarter, the company is paying more for every additional dollar it sells.
Net income and cash flow answer different questions, and the gap between them is where profit quality shows. Net income follows accounting rules: it books revenue when earned rather than when cash lands, and it spreads or defers various costs. Cash flow tracks the money that actually moved through the business.
Check four figures:
Net income
Operating cash flow
Capital expenditure
Free cash flow
Operating cash flow is the cash thrown off by normal operations. Free cash flow generally subtracts capital expenditure, though companies may define it differently, so read the label before comparing it across firms.
The two lines separate for a reason. A growing company can report rising profit while free cash flow weakens, because receivables, inventory or capital spending tie the cash up before it arrives. One quarter of that may be timing. A repeated gap between rising earnings and falling cash deserves attention.
Money spent on factories, data centres or equipment can support future growth, so the number alone is neither good nor bad. The harder question is whether revenue, margins and cash generation are improving fast enough to justify it.
Segment reporting breaks total revenue into products, regions and divisions, and it shows which part of the company is actually driving the result. A single company-wide growth rate can hide very different performances underneath.
Ask four questions of the segment table:
Which segment produced most of the growth?
Is growth broad, or concentrated in one place?
Is one division masking weakness elsewhere?
Is the fastest-growing segment large enough to move the total?
Microsoft is a clear case. Its fiscal Q3 2026 revenue rose 18%. Intelligent Cloud revenue rose 30%, with Azure up 40%, while More Personal Computing revenue fell 1% as Windows OEM and Devices and Xbox content and services declined. The company-wide figure was strong, but the segments showed cloud and AI carrying most of the momentum.
Concentrated growth is not automatically a weakness. It does mean the result leans heavily on the demand, margins and competitive position of that one segment, which is where the next quarter’s risk sits too.
Unusual items are gains or costs that fall outside ordinary operations, and they can push headline EPS well away from the underlying trend. A single line in the footnotes can explain most of a move in reported earnings.
Look for:
Tax benefits
Investment gains
Asset sales
Legal settlements
Restructuring charges
Acquisition costs
Repeated “one-time” adjustments
Meta reported Q1 earnings per share of $10.44, up 62%, after recognising an $8.03 billion income-tax benefit. The company disclosed that EPS would have been $3.13 lower without it. The benefit was real and belonged in reported earnings. It did not make Meta’s ordinary operations 62% more profitable.
One question does most of the work here: would this profit still exist if the unusual item disappeared?
It also helps to set adjusted earnings beside GAAP earnings. Adjusted figures can strip out genuine one-off events, but repeated exclusions may make the underlying cost base look cleaner than it is, so read every item in the reconciliation.
A stock does not react to the quarter alone; it reacts to how the quarter compares with what was already assumed. The price going into the report embeds a forecast, so the reaction reflects the distance between the result and that expectation, not the result on its own.
Ask three questions:
Did revenue and EPS beat analyst estimates?
Did management raise or cut guidance?
Did the result justify the valuation investors were already paying?
Published analyst estimates are only one level of expectation. A stock that has run hard may already price in assumptions well above consensus. Suppose a company trades at 50 times earnings because the market expects exceptional growth. A 10% earnings beat can still land as a disappointment when the price demanded much more.
That gap between a good quarter and a good result against expectations is why similar beats produce different reactions:
Beat and raise strengthens the forward outlook.
Beat and maintain can disappoint when expectations were already high.
Beat and cut weakens the future earnings path.
Miss and raise can suggest the weakness was temporary.
The earnings result and the share-price result measure two different things. One describes the business, the other measures that business against what the market had assumed.
Read the share price only after you have read the numbers. Starting with the price tends to turn analysis into a search for evidence that fits the move, rather than an independent reading of the report.
Watch four things:
The initial after-hours move
The price after the earnings call
Changes in analyst estimates
How management explains demand, costs and guidance
After-hours trading is often thin, so the first move can reverse during the call or the next session. Even a clear beat can leave a stock flat when the result only matched what was priced in. The most useful signal is usually the figure management keeps returning to under questioning. A revenue beat followed by repeated questions about margins points to profitability driving the reaction; a strong quarter followed by questions about capital spending points to future returns on that spending as the real issue.
After 10 minutes, sort the report into one of three buckets. The framework does not predict what the stock must do next. It tells you whether the report strengthened or weakened the business case behind the price.
Guidance was raised
Revenue and operating income grew
Margins were stable or improving
Free cash flow supported reported profit
Growth was reasonably broad
Revenue and EPS beat estimates
Costs or capital expenditure rose sharply
Margins weakened
Growth depended heavily on one segment
Guidance was unchanged
Guidance was cut
Revenue growth slowed
Costs rose faster than sales
Cash flow deteriorated
EPS leaned heavily on unusual gains or adjustments
Use the company’s investor-relations website or the SEC’s EDGAR database. Look for the earnings release, the Form 8-K and the Form 10-Q rather than relying on news summaries, which compress the detail that the six checks depend on.
Use both. Year-over-year comparisons strip out seasonal swings and show the underlying trend, while quarter-over-quarter figures capture recent momentum. The quarter-over-quarter view matters most when demand, pricing or costs shifted sharply during the latest three months.
Yes. Adjusted figures can remove genuine one-off costs, but repeated exclusions can flatter profitability over time. Compare adjusted earnings with GAAP results and read every item in the reconciliation before trusting the adjusted number.
The company may have cut guidance, reported weaker margins or generated less cash than the profit suggested. The stock may also have been priced for a result well above published analyst estimates, so even a beat undershoots what the valuation already assumed.
An earnings report can show a beat while the business behind it weakens, which is the whole point of learning how to read an earnings report: read the figures in order and judge whether the quarter improved the company and cleared the expectations already in the price. Guidance sets the forward outlook, revenue shows demand, margins show operating efficiency, cash flow tests profit quality, segments reveal the source of growth, and the footnotes expose the unusual items.
Read those figures in that order when time is short. EPS tells you what was reported. The rest of the report tells you whether it was earned.