Published on: 2025-05-21
Updated on: 2025-05-21
The Wyckoff Method, developed by legendary trader Richard D. Wyckoff in the early 20th century, remains one of the most respected frameworks for analysing price behaviour in financial markets.
Among its core concepts, Wyckoff Accumulation stands out as a foundational pattern that signals the transition from a bearish to a bullish market environment.
In this comprehensive guide, we will explore its key phrases, how to identify them on charts, and the trading strategies derived from this structure.

Wyckoff Accumulation is a market phase in which institutional investors and smart money gradually accumulate shares after a significant downtrend, even as the public tends to be bearish. This phase is characterised by price consolidation and often serves as a precursor to a new bull market or upward trend.
The process of accumulation is not random. It follows a structured pattern that unfolds in five distinct phases, each with its characteristics, psychological context, and trading opportunities. These phases allow traders to understand the underlying supply and demand dynamics before a breakout occurs.
The Five Key Phases
Wyckoff Accumulation is typically broken into five primary phases (A to E). Each phase reveals specific price behaviour and participant psychology.
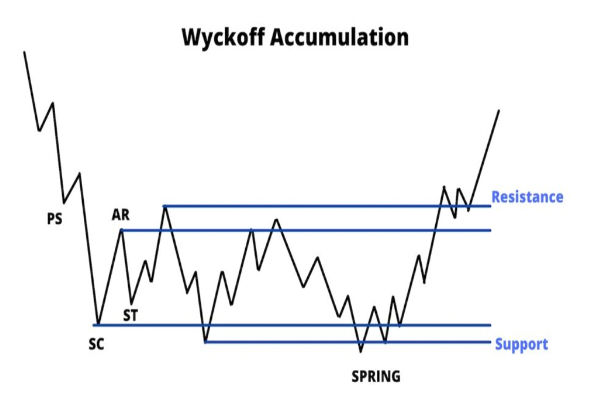
Phase A: Stopping the Downtrend
This is where the prior downtrend begins to lose momentum. The main objective of Phase A is to halt the price decline through preliminary support (PS) and a selling climax (SC).
Preliminary Support (PS): Initial signs of large buying appear, but not enough to reverse the trend.
Selling Climax (SC): Panic selling reaches its peak; heavy volume and wide price spreads occur.
Automatic Rally (AR): Strong rebound from the SC as sellers are exhausted and buyers step in.
Secondary Test (ST): Price returns to the area of the SC to test the supply/demand balance.
The range between the AR and ST helps define the outer boundaries of the trading range.
Phase B: Building a Cause
This phase is the longest and most deceptive, as the price moves sideways within a defined range. Institutions are accumulating shares without pushing the price up significantly.
False breakouts, shakeouts, and whipsaws are common here.
Volume analysis is key: look for higher volume on up moves and lower volume on down moves.
This phase often tests the patience of retail traders who may exit out of boredom or frustration. Phase B sets the foundation (or "cause") for the upcoming price move (the "effect"), following Wyckoff's law of cause and effect.
Phase C: Spring and Test
Phase C is where things get interesting. Here, the market undergoes a spring — a deliberate false breakdown of the trading range to shake out weak holders.
Spring: Price breaks below support, creating fear and triggering stop-losses.
Test: Price returns to the trading range, confirming the spring was a bear trap.
This is a critical area where smart money finishes accumulating shares at a discount. Traders who recognise the spring and successful test have the best low-risk, high-reward entry opportunities.
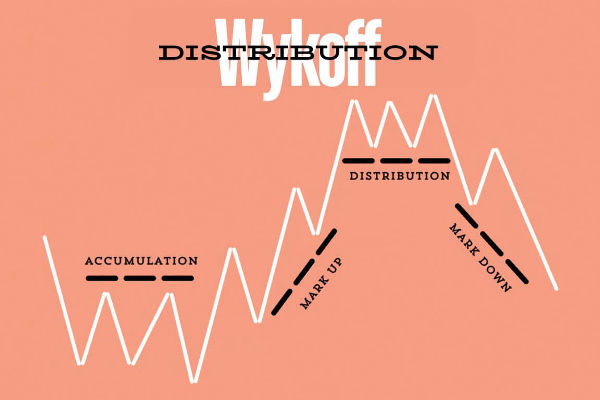
Phase D: Markup Begins
Phase D signifies the start of an uptrend. The price creates higher highs and higher lows, with increased volume confirming demands.
Sign of Strength (SOS): A rally with wide price spreads and strong volume.
Last Point of Support (LPS): A higher low formed after the SOS; an ideal place to add positions.
This phase signals the transition from accumulation to trending behaviour. Breakouts above resistance now sustain and confirm the start of a bull move.
Phase E: Uptrend and Distribution
In Phase E, the market leaves the accumulation range and enters a clear uptrend. This is the phase where the public starts to recognise the trend, often too late.
While Phase E isn't technically part of the accumulation, it validates the prior phases and marks the payoff for traders who entered earlier.

Identifying Wyckoff Accumulation in real-time can be challenging but rewarding. Here's how to do it:
Look for a prior downtrend. Accumulation always follows a decline.
Define the trading range between the automatic rally and the selling climax.
Label key events such as the SC, AR, ST, Spring, and SOS.
Use volume as a filter: increasing volume on rallies and decreasing volume on pullback signal accumulation.
Watch for fake breakdowns near support levels (the spring).
Real-World Example
In 2020, Tesla's stock went through a textbook Wyckoff Accumulation pattern:
A steep correction followed by a selling climax and an automatic rally.
Prolonged sideways movement forming the trading range.
A final spring in March followed by a rally (SOS).
Breakout and multi-month uptrend.
The importance of Wyckoff Accumulation lies in its predictive power. Recognising accumulation early allows traders to enter positions before the crowd, reducing risk and maximising profit potential. It also provides context to market activity, enabling traders to separate random noise from institutional intent.
Understanding this phase helps answer critical questions:
Is this consolidation just a pause in a downtrend or a true bottom?
Are institutions accumulating shares or distributing them?
When is the best time to enter a trade?

Entry Points
Spring + Successful Test: This is the most reliable entry with minimal risk.
Last Point of Support (LPS): Another low-risk entry with confirmation from price action.
Breakout of the Resistance Range: Enter on the breakout with volume confirmation, though risk is slightly higher.
Stop Loss Placement
Place stops just below the spring or recent low.
Use support levels within the trading range for tight risk control.
Profit Targets
Measure the height of the trading range (AR to SC) and project it upward from the breakout.
Use Fibonacci extensions and prior resistance zones as additional guides.
Risk Management
Never risk more than 1–2% of your capital per trade.
Size your position based on the distance between the entry and stop-loss.
Backtesting and Confirmation
Use multiple timeframes to confirm the pattern.
Combine Wyckoff analysis with RSI, MACD, or Volume Profile for added confidence.
In conclusion, Wyckoff Accumulation is more than just a pattern — it's a deep insight into market psychology, institutional behaviour, and supply-demand dynamics. By studying its five key phases, traders can anticipate trend reversals, enter trades at optimal levels, and significantly reduce risk.
Though it takes time and practice to master, it remains one of the most reliable methods for spotting long-term bullish setups across markets. As with any strategy, combining it with sound risk management, patience, and chart time is essential for success.
Disclaimer: This material is for general information purposes only and is not intended as (and should not be considered to be) financial, investment or other advice on which reliance should be placed. No opinion given in the material constitutes a recommendation by EBC or the author that any particular investment, security, transaction or investment strategy is suitable for any specific person.