Published on: 2026-09-09
Updated on: 2026-09-09
When a large stock falls sharply, headlines often describe the move in dramatic dollar terms: “$50 billion wiped from market value” or “$100 billion erased in one session.”
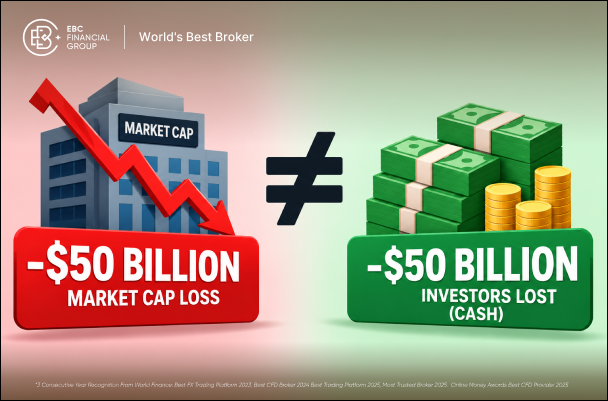
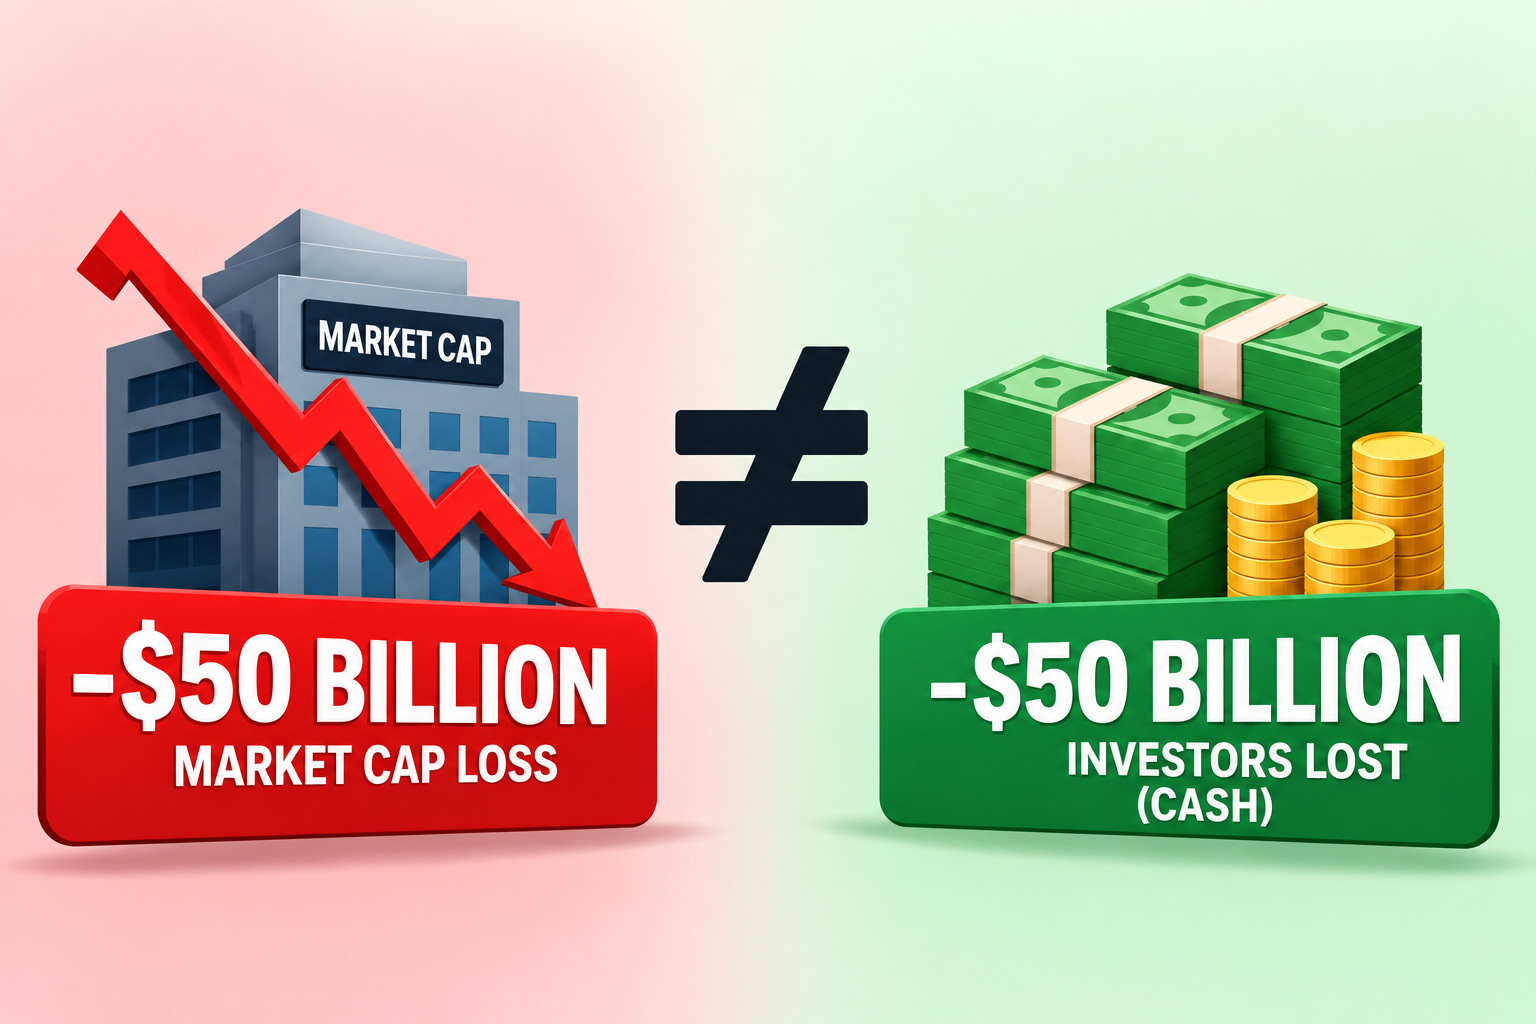
Those figures are real, but they are easy to misinterpret. A $50 billion market-cap decline represents a $50 billion reduction in the marked value of the company’s outstanding equity, but it does not mean $50 billion of cash left the stock or that shareholders necessarily realised $50 billion of losses.
Market capitalisation is calculated as:
Market capitalisation = share price × shares outstanding
Suppose a company has 1 billion shares outstanding and trades at $200 per share.
Its market capitalisation is:
1 billion × $200 = $200 billion
If the share price falls to $150 while the share count remains unchanged, market capitalisation falls to:
1 billion × $150 = $150 billion
The company’s outstanding equity has therefore been marked $50 billion lower.
That reduction is real. Existing shares are now collectively valued about $50 billion below their previous market value. What the calculation does not show is how much cash changed hands, how many shares were traded, whether individual shareholders sold, or whether the company itself lost any cash or assets.
| A “$50B market-cap loss” means | It does not necessarily mean |
|---|---|
| Outstanding equity is marked about $50B lower | $50B of cash left the stock |
| Existing holdings are worth less at current prices | $50B worth of shares changed hands |
| The market has repriced the equity | Every shareholder realised a loss |
| Aggregate marked equity value is lower | The company lost $50B of cash or assets |
This distinction is important because market capitalisation is a valuation based on the prevailing share price, not a record of money flowing into or out of the stock.
Stock prices are established through transactions between buyers and sellers at the margin.
Only a portion of a company’s shares may trade during a particular session, yet the latest market price is used to value the entire share base.
Using the same example, all 1 billion shares do not need to trade at $150 for the company’s market capitalisation to fall to $150 billion. Sellers may begin accepting $190 after an earnings disappointment. Buyers then reduce their bids to $180, $165 and eventually $150 as expectations weaken.
Once the stock is trading around $150, that price becomes the reference point for valuing the outstanding shares.
A pension fund holding 20 million shares may not have sold anything. A founder could retain an entire stake, while long-term funds may remain invested. Their holdings are nevertheless marked at the new market price.
The same process works in reverse. If the share price later rises from $150 to $180, the company’s market capitalisation increases by $30 billion without requiring $30 billion of cash to enter the stock.
Market-cap changes are therefore driven by the price at which the equity is currently valued, not by an equal amount of money entering or leaving the market.
There is another consequence of using the prevailing share price to value every outstanding share: market capitalisation should not be treated as the amount shareholders could collectively receive if everyone tried to sell at once.
Suppose a company has 1 billion shares and the latest traded price is $150. Its market capitalisation is $150 billion, but that does not guarantee that all 1 billion shares could be sold for $150 each.
If a very large proportion of shareholders tried to liquidate simultaneously, the additional supply would probably push the share price lower unless sufficient buyers were willing to absorb the selling at the existing price.
Market cap is therefore a mark-to-market equity valuation. It applies the current marginal market price across the outstanding share base. It is not necessarily the cash value obtainable from liquidating every share at that same quoted price.
This also explains how tens of billions of dollars in market value can disappear even when the dollar value of actual trading is much smaller.
Shareholders can lose substantial wealth when a stock falls, but it is important to distinguish a decline in current market value from a loss relative to the price they originally paid.
Suppose an investor owns 10,000 shares.
At $200, the position is worth $2 million. At $150, it is worth $1.5 million. The current market value of the position has declined by $500,000.
If the investor bought those shares at $200 and sells at $150, the $500,000 decline becomes a realised loss.
Now consider another shareholder who bought at $80. After the stock falls from $200 to $150, that investor remains up $70 per share relative to the original cost basis. However, the position still experienced a $50-per-share mark-to-market decline during the move from $200 to $150.
Both statements are true. The shareholder remains profitable relative to the purchase price while also having experienced a reduction in wealth during the selloff.
Individual results can differ further because shareholders have different entry prices, position sizes, hedges and exit decisions. A short seller may even profit when the stock falls.
Portfolio exposure also matters. If a stock falls 20% but accounts for only 2% of a diversified portfolio, the direct impact is roughly 0.4% before movements elsewhere. If the stock represents 25% of the portfolio, the same decline reduces portfolio value by roughly 5%.
The market-cap loss and an individual investor’s financial outcome should therefore not be treated as interchangeable.
Market capitalisation measures the market value assigned to a company’s common equity. It is not the same as the total value assigned to the operating business.
Enterprise value provides a broader measure by also considering debt and cash.
For example, suppose a company has:
a market capitalisation of $150 billion;
$80 billion of debt; and
$30 billion of cash.
Using the simplified calculation:
Enterprise value = market cap + debt − cash
its enterprise value would be approximately $200 billion.
A $50 billion decline in market capitalisation therefore refers specifically to a change in the market value of the equity. It should not automatically be described as a $50 billion reduction in every measure of what the wider business is worth.
This distinction becomes particularly useful when comparing companies with very different debt and cash positions.
The headline dollar figure can exaggerate or understate the severity of a move if the company’s starting valuation is ignored.
Consider two companies:
| Company | Previous Market Cap | $50B Loss as % |
|---|---|---|
| Company A | $1 trillion | 5% |
| Company B | $100 billion | 50% |
Both lost $50 billion in market value, but the investment implications are very different.
A 5% decline in a trillion-dollar company could reflect an earnings reaction, interest-rate repricing or a modest change in expectations. A 50% collapse in a $100 billion company points to a much more severe reassessment of earnings, financial strength or business risk.
The next step is to identify what caused the repricing.
A share price can fall because expected earnings declined, because the valuation multiple contracted, or because both occurred together.
Suppose a company was expected to earn $10 per share but weaker guidance reduces forecasts to $7. A lower share price may be justified because future profitability is now expected to be lower.
Alternatively, consider a company earning $5 per share. At a price-to-earnings ratio of 40, the stock trades around $200. If the market becomes willing to pay only 30 times earnings, the same $5 of earnings supports a price closer to $150 even though earnings themselves have not changed.
Multiples can contract when interest rates rise, growth expectations weaken, competitive risks increase or a previously favoured sector loses momentum.
The two forces can also occur together. A company may continue growing but still fall sharply if growth is weaker than previously expected and the market simultaneously reduces the multiple it is willing to pay.
For that reason, potential investors should compare what the market expected before the decline with what it expects afterward rather than focusing only on whether the latest headline numbers were positive or negative.
A large market-cap loss does not automatically make a stock cheap.
A share falling from $200 to $150 is cheaper than it was before, but it can remain expensive relative to earnings, cash flow and realistic growth prospects.
Suppose a stock traded at 50 times expected earnings before falling 25%. If earnings estimates remain unchanged, it could still trade near 38 times earnings. If forecasts have also been cut, the apparent valuation improvement may be even smaller.
Potential investors should therefore judge the new price against the company’s fundamentals rather than its previous share price.
Relevant measures can include forward price-to-earnings ratios, free-cash-flow yield, enterprise value to EBITDA, earnings growth, margins, debt levels and the company’s historical valuation range.
Closer scrutiny is particularly important when the decline follows a major earnings downgrade, weaker margins, falling free cash flow, rising debt, the loss of a major customer, regulatory restrictions or management withdrawing guidance.
A steep decline may create an opportunity if the market has overreacted, but it can also reflect a genuine deterioration in the investment case. The important comparison is between the size of the valuation decline and the severity of the change in expected future fundamentals.
A $50 billion market-cap decline means the market value assigned to a company’s outstanding equity has fallen by about $50 billion, assuming its share count is unchanged. That reduction in marked equity value is real, but it is not equivalent to $50 billion of cash leaving the stock, $50 billion of shares being traded or $50 billion of losses being realised by shareholders.
The figure is also a mark-to-market valuation rather than a guaranteed liquidation value, and it refers to equity value rather than enterprise value.
For potential investors, the headline should therefore be the starting point rather than the conclusion. The more useful analysis is to measure the percentage decline, identify whether earnings expectations or valuation multiples changed, assess the company’s revised fundamentals and decide whether the new price adequately compensates for the risks behind the repricing.