Bollinger on Bollinger Bands, authored by John Bollinger, is a definitive guide that delves into the creation and application of one of the most essential tools in technical analysis.
First introduced by Bollinger in the 1980s, Bollinger Bands have since become a cornerstone for traders worldwide, helping them assess market volatility and identify key price movements.
In this book, Bollinger not only explains the theory behind his famous indicator but also provides practical insights into how traders can effectively use it to refine their strategies and navigate various market conditions.
Whether you're a beginner or an experienced trader, Bollinger on Bollinger Bands offers invaluable knowledge on leveraging this powerful tool to predict trends, spot breakouts, and enhance trading accuracy.
Understanding Bollinger Bands: The Basics

Before diving into advanced applications, it is essential to first understand the basic structure and function of Bollinger Bands. This section outlines the key components and concepts that underpin this powerful indicator.
1. What Are Bollinger Bands?
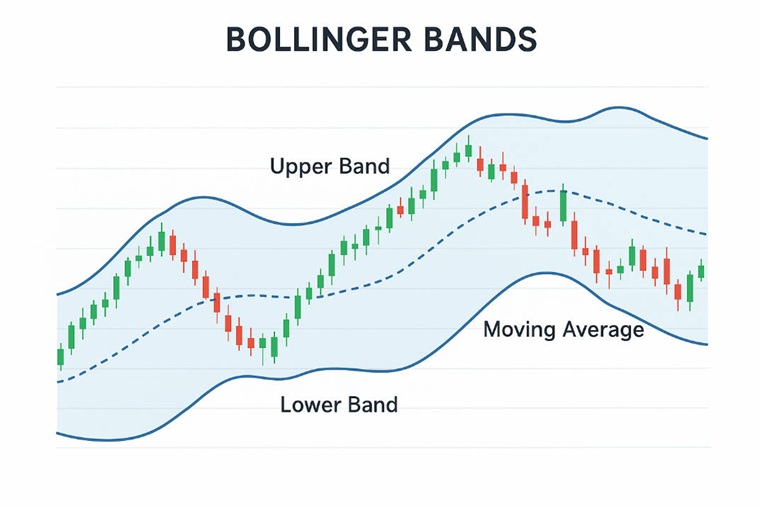
Bollinger Bands consist of three key components, plotted on a price chart:
Middle Band (20-period Simple Moving Average or SMA):
The middle band is the most fundamental part of the Bollinger Bands. It is a simple moving average (SMA) of the asset's price over a defined period, typically set to 20 periods. The SMA serves as the central reference point for price action.
Upper Band:
The upper band is calculated by adding two standard deviations of the price to the middle band. This band moves higher when market volatility increases, and lower when volatility decreases, providing an indication of overbought conditions.
Lower Band:
The lower band is calculated by subtracting two standard deviations of the price from the middle band. It functions similarly to the upper band but indicates oversold conditions when prices approach or fall below it.
2. How Bollinger Bands Work

The beauty of Bollinger Bands lies in their ability to adapt to changing market conditions:
The bands contract, indicating that the market is experiencing lower volatility. A contracted Bollinger Band often signals the potential for a breakout, as the price may soon break out of the narrow range.
The bands expand, indicating greater market volatility. A wide band signals an active market, with prices potentially undergoing significant fluctuations in either direction.
Upper Band: Signals that the price is nearing overbought conditions.
Lower Band: Suggests that the price may be oversold.
-
Between the Bands: Indicates a normal price range within expected volatility.
3. Key Concepts of Bollinger Bands
To make the most out of Bollinger Bands, it's important to understand some key concepts that underpin their use:
1) Overbought and Oversold Conditions:
When the price is near the upper band, the asset might be overbought, signalling a possible reversal or pullback. Conversely, when the price is near the lower band, the asset may be oversold, indicating potential for a price rebound.
2) The Squeeze:
A squeeze occurs when the bands contract, signalling that volatility is low. This often precedes significant price movements, either in the form of a breakout or a sharp reversal. Traders use this pattern to anticipate potential trading opportunities.
3) Breakouts:
A breakout happens when the price moves outside the bands, indicating that a significant trend may be starting. It is often viewed as a strong signal for traders to enter the market, depending on the direction of the breakout.
Core Principles of Bollinger Bands: Insights from the Book

In Bollinger on Bollinger Bands, John Bollinger elaborates on the core principles that govern the indicator. The book offers extensive guidance on interpreting and using Bollinger Bands effectively in real-world trading scenarios.
At or above the upper band: Momentum remains strong, but a pullback may follow.
At or below the lower band: Selling pressure may be exhausted, suggesting a potential rebound.
Between the bands: Normal trading conditions, where price fluctuates within expected volatility.
Band width is another key concept. Narrow bands indicate consolidation, while wide bands reflect market expansion. The SMA (middle band) serves as a trend filter—when prices hold above it, the market is generally bullish; when below, bearish.
Practical Applications
Bollinger Bands can guide traders in timing market entries and exits, identifying reversals, and confirming trends.
1. Entry and Exit Strategy
Buy near the lower band when other indicators confirm oversold conditions.
Sell near the upper band if signals suggest the asset is overbought.
Exit trades when prices revert toward the middle band after reaching extremes.
2. Spotting Breakouts and Reversals
Breakout: A move beyond the bands often signals the start of a new trend. Volume confirmation helps validate this signal.
Reversal: When price touches a band but fails to break through, returning toward the middle line, it can suggest a change in momentum.
3. Combining with Other Indicators
Bollinger emphasises complementing his indicator with others for confirmation:
RSI (Relative Strength Index): Confirms overbought or oversold conditions.
MACD (Moving Average Convergence Divergence): Validates trend strength and direction.
Advanced Concepts and Adaptation

A standout concept from the book is the Bollinger Band Squeeze—a signal that volatility has tightened to its lowest level. When the squeeze ends and price breaks beyond the range, traders can enter trades aligned with the breakout direction.
Bollinger also discusses customising settings. While 20 periods and two standard deviations are standard, traders can adjust these parameters based on the asset's volatility or timeframe. The indicator's flexibility allows it to work across equities, forex, and commodities.
Psychologically, the bands mirror crowd emotion. Moves outside them often signal extremes in fear or greed—conditions that can swiftly reverse when sentiment changes.
Common Pitfalls
Over-reliance: Never depend solely on Bollinger Bands. Use them as part of a broader analysis.
False Breakouts: Not every breakout leads to a sustained move. Wait for confirmation signals.
Ignoring Risk Management: Effective stop-loss placement and position sizing remain essential to protect against false signals.
Conclusion: Why Bollinger on Bollinger Bands is Essential Reading for Traders
Bollinger on Bollinger Bands offers a deep and thorough analysis of one of the most valuable tools in technical analysis. From its creation to real-world applications and advanced strategies, the book provides invaluable insights for traders who wish to enhance their understanding of market trends and volatility.
Disclaimer: This material is for general information purposes only and is not intended as (and should not be considered to be) financial, investment or other advice on which reliance should be placed. No opinion given in the material constitutes a recommendation by EBC or the author that any particular investment, security, transaction or investment strategy is suitable for any specific person.


