The AAXJ ETF (iShares MSCI All Country Asia ex Japan ETF) is a broad, passively managed exchange-traded fund that offers investors exposure to large- and mid-capitalisation equities across Asia excluding Japan.
It is a convenient vehicle for an Asia-tilt within a global equity allocation: diversified across countries such as China, India and South Korea, concentrated in technology and financials, and managed by BlackRock's iShares platform. Key quick facts (current as of mid-October 2025):
Net assets: ~USD 3.17 billion.
Expense ratio: 0.72% (net).
Number of holdings: ~920.
This article explains what AAXJ is, how it is constructed, its historical performance, principal strengths and risks, and how investors might use it within a portfolio.
What the AAXJ ETF is — investment objective and index
The fund's formal objective is to track the MSCI All Country Asia ex Japan Index by investing primarily in the index's component securities. AAXJ is therefore best understood as a passive, index-tracking ETF offering broad Asia ex-Japan equity exposure.
The index excludes Japan deliberately to increase weight to other Asian markets — notably China, India and South Korea — so the ETF captures both developed and emerging Asian economies (Hong Kong and Singapore included).
This makes AAXJ different from a pan-Asia ETF that includes Japan, and from narrow single-country or single-sector products.
How the AAXJ ETF Works: Structure, Replication, and Operations

1) Structure:
AAXJ is an open-ended ETF listed on NASDAQ (ticker: AAXJ). The fund invests at least 80% of its assets in components of the underlying MSCI index or securities with substantially identical economic characteristics.
3) Replication:
The fund uses a replication approach aligned with the MSCI methodology. It is broadly market-cap weighted and rebalances periodically according to MSCI's schedule.
3) Distributions:
AAXJ distributes income; its 12-month trailing yield and the SEC 30-day yield are published on the issuer's pages and updated regularly. As of late-September 2025 the 30-day SEC yield was ~1.27% and 12-month trailing yield ~1.79%.
Core Fund Metrics of the AAXJ ETF
Below is a concise table of the most relied-upon fund metrics. These items are important when comparing AAXJ with alternatives.
| Metric |
Value (mid-Oct 2025) |
| Net assets (AUM) |
USD 3.17 billion |
| Expense ratio (net) |
0.0072 |
| Inception date |
39673 |
| Number of holdings |
~920 |
| 30-day SEC yield |
~1.27% |
| 3-yr standard deviation (annualised) |
~18.27% |
| 3-yr equity beta (vs global markets) |
~0.67 |
(Values are taken from the iShares product pages and the fund fact sheet; investors should check the issuer for the latest numbers before making decisions.)
AAX ETF Portfolio composition — sector and country exposures
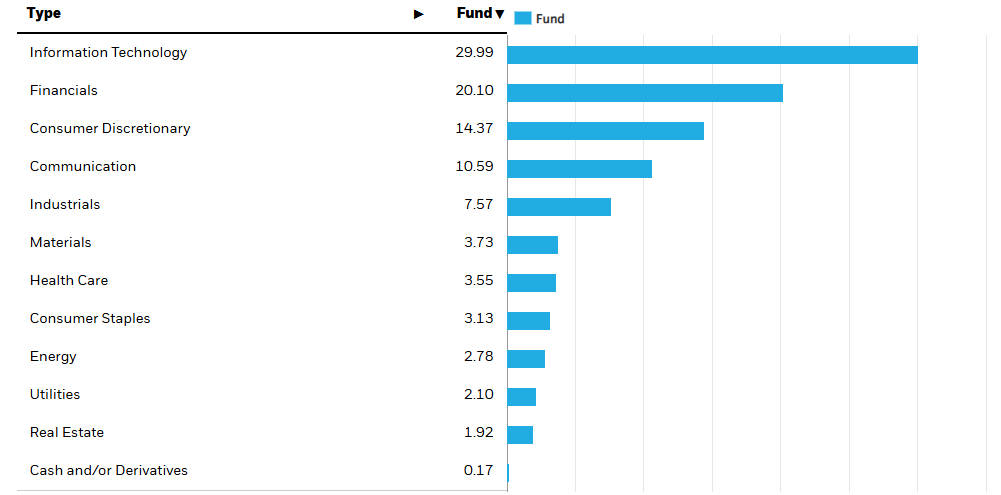
1) Sector exposures
Technology: approximately ~29% of the fund.
Financial services: around ~20%.
Consumer discretionary and communications: meaningful tilts thereafter.
These sector weights reflect the index's market-cap weighting and the dominance of large technology companies in several Asian markets.
2) Country exposures
AAXJ is concentrated in a handful of markets. Representative country weights (approximate, mid-Oct 2025):
China (incl. mainland-listed & ADRs / Hong Kong exposures via China names): ~28%.
Taiwan, China: ~22–23%.
India: ~16%.
South Korea: ~12%.
Hong Kong: ~6%.
Remaining weights: Singapore, Malaysia, Thailand, Indonesia, etc., make up the rest.
These splits matter because they determine the fund's sensitivity to policy, currency and economic developments in each jurisdiction.
Top holdings of the AAXJ ETF
| Holding |
Approx. weight (%)
|
| Taiwan Semiconductor Manufacturing Co. (TSMC) |
~12–13% |
| Tencent Holdings |
~6% |
| Alibaba Group |
~4–5% |
| Samsung Electronics (via ADRs / listings) |
~3–4% |
| Other large caps (e.g., SK Hynix, Meituan, Reliance) |
smaller single digits |
(Note: Holdings and weights are updated periodically; the figures above are rounded and based on the most recently published holdings lists. Always confirm the current holdings before making an investment decision.)
Historical performance and behaviour

1) Recent returns:
AAXJ has posted strong year-to-date returns in 2025 (YTD in the mid-to-high-20s percent range, depending on the snapshot), reflecting a rebound in several Asian markets and heavy gains in semiconductor, internet and domestic-demand stocks. For example, iShares reported a YTD NAV total return of ~28% as of 13 October 2025.
2) Trailing returns:
Trailing 1-year and multi-year returns vary by data provider and date of calculation, but recent 1- to 3-year annualised returns have been positive and have outpaced some broad emerging market indices at times. See issuer pages and independent data sources for standardised performance.
3) Volatility & drawdowns:
AAXJ exhibits higher volatility than developed-market broad indices (three-year annualised standard deviation around 18%). The fund's historical maximum drawdowns are meaningful — investors should expect extended periods of negative returns during severe market stress (as is typical for Asia-centric equity exposures).
4) Drivers of returns:
Over recent cycles, performance has been driven by:
Large technology and semiconductor companies (TSMC, Samsung, chip manufacturers).
Chinese internet and e-commerce names (when regulatory headwinds ebb).
Indian large-cap strength during periods of domestic growth optimism.
Comparative analysis — AAXJ versus peers

1) Peers:
ETFs such as Vanguard's VPL (Pacific), iShares' EEMA (emerging markets Asia) and other Asia ex-Japan or Asia-Pacific funds compete with AAXJ for investor attention. Differences typically lie in index construction, country coverage, fee structure and liquidity.
2) Fees and liquidity:
3) When AAXJ is preferable:
Investors seeking a single-ticket, market-cap weighted exposure to Asia excluding Japan.
Those who want access to a blend of developed and emerging Asian markets (notably Chinese Taiwan and India) rather than a pure EM basket.
Strengths — why investors choose AAXJ
Broad, diversified regional exposure: The fund covers multiple Asian economies, allowing investors to capture regional secular trends without building a multi-ETF structure.
Access to leading growth sectors: Large allocations to technology and consumer-oriented sectors provide exposure to secular growth themes (semiconductors, internet platforms, fintech).
Transparent passive rule set: Tracking a well-established MSCI index ensures transparent methodology and predictable reconstitution cycles.
Operational reliability: Managed by BlackRock/iShares, AAXJ benefits from the platform’s distribution, trading ecosystem and market-making capabilities.
Principal risks and limitations
Investors should weigh several important risks before adding AAXJ to a portfolio:
Concentration risk: The top 10 holdings can represent a material portion of assets (often 30%+), so performance may be dominated by a small group of mega-caps.
Country and policy risk: Exposure to China and other markets creates sensitivity to domestic policy, regulatory changes, geopolitical tensions and trade developments. These single-country shocks can materially impact returns.
Currency risk: AAXJ is USD-listed but holds securities denominated in various Asian currencies and USD-listed ADRs; FX movements affect returns for unhedged investors.
Market volatility: Compared with global large-cap indices, Asia ex-Japan can be more volatile and subject to abrupt sentiment shifts. Historical standard deviation and drawdowns support this.
Tracking error: Although the fund aims to replicate its MSCI benchmark, fees, sampling, trading costs and corporate actions create tracking differences over time.
Market outlook and macro considerations (practical perspective)
Short-term: Near-term performance will largely depend on cyclical swings — semiconductor demand, China's economic policy and reopening dynamics, India's domestic momentum, and global interest-rate moves.
Medium–long term: Structural trends likely to support Asian equities include continued technological upgrading, rising domestic consumption across populous markets, and regional supply-chain importance (semiconductors, electronics). However, demographic and political risks differ by country.
Bull case: Chinese policy stabilises, global demand for semiconductors remains robust, India sustains growth; AAXJ outperforms world equities.
Base case: Moderate growth across Asia with periodic volatility; AAXJ delivers positive but uneven returns.
Bear case: Policy or geopolitical shocks in China, global recession, or tech slowdown triggers outsized drawdowns in AAXJ.
How to use AAXJ in portfolio construction
Correlation with U.S. equities is significant but not perfect (3-yr beta ~0.67). AAXJ can provide diversification benefits while increasing exposure to Asia's growth drivers.
Consider currency exposure and tax implications (dividends from foreign companies).
Use limit orders for large executions; monitor bid-ask spreads even though they tend to be modest.
Frequently asked questions
Q1: What index does AAXJ track?
The MSCI All Country Asia ex Japan Index.
Q2: What is the fund's expense ratio?
0.72% (net) as reported in the fund's prospectus and fact sheet.
Q3: Does AAXJ pay dividends? If so, how often?
Yes — distributions are made periodically; check the iShares distribution schedule for exact dates and historical amounts.
Q4: Is AAXJ suitable for long-term investors?
It can be, provided investors accept higher volatility and country-specific risks associated with Asia ex-Japan equities. Long-term returns depend on regional economic trajectories and sector leadership.
Q5: How does AAXJ differ from a plain emerging-markets ETF?
AAXJ includes developed Asian markets (e.g., Chinese Taiwan, Hong Kong, Singapore) and excludes Japan; its country mix and sector profile differ from broader EM funds that often include Latin America, EMEA and other regions.
Conclusion — practical judgement for investors
AAXJ is a credible, single-ticket solution for investors who want diversified exposure to Asia excluding Japan. It provides concentrated exposure to structural growth areas such as semiconductors and internet platforms, while balancing developed and emerging market allocations.
The fund's expense ratio and concentration in large caps warrant consideration, but the iShares platform's transparency and liquidity are advantages.
Who might consider AAXJ?
Investors seeking an Asia-tilt without Japan in a simple, passive wrapper.
Portfolio managers wanting a traded, USD-listed vehicle to adjust regional weightings quickly.
Who might avoid (or supplement) AAXJ?
Investors seeking lower fees or narrower country exposure (they might prefer alternative ETFs).
Those who require currency-hedged exposure or who want to avoid heavy concentration in a handful of mega-caps.
Disclaimer: This material is for general information purposes only and is not intended as (and should not be considered to be) financial, investment or other advice on which reliance should be placed. No opinion given in the material constitutes a recommendation by EBC or the author that any particular investment, security, transaction or investment strategy is suitable for any specific person.


