Published on: 2025-07-08
Updated on: 2025-09-26
In financial trading, understanding the emotions that drive market movements is crucial. Traders have always recognised that fear, greed, hope, and doubt can greatly affect asset values.
To help quantify these collective emotions, tools like the Market Mood Index (MMI) have been developed. But what exactly is the Market Mood Index, how does it work, and why is it gaining popularity among traders?
This detailed guide will examine the significance of the Market Mood Index, its operation, and how traders utilise it to enhance their decision-making and achieve better results in fluctuating markets.

The Market Mood Index is a sentiment analysis tool designed to measure the emotional tone of the financial markets at a given moment. Unlike traditional technical or fundamental indicators that rely on price data, earnings, or macroeconomic trends, the MMI focuses on investor psychology.
The index captures how market participants feel—whether they are fearful, euphoric, uncertain, or confident. It aggregates this data from a variety of sources, including news sentiment, trading behaviour, options activity, volatility indices, and social media trends.
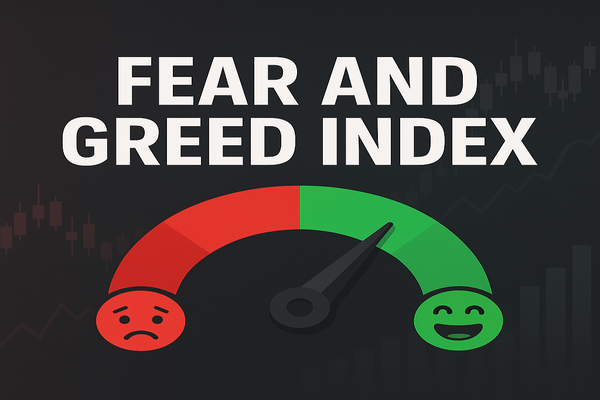
Similar to the better-known Fear & Greed Index, the MMI reflects the emotional state of the market, but often with more granularity or real-time updates depending on the source. It's not an official index like the S&P 500 or Dow Jones but rather a proprietary or compiled sentiment model offered by brokers, research firms, or platforms that specialise in behavioural finance.
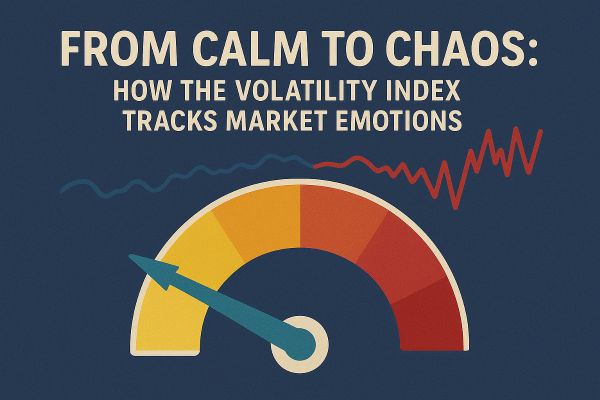
Market volatility is often seen as a sign of investor fear or uncertainty. A spike in the VIX (Volatility Index), for example, usually correlates with declining investor confidence. The MMI incorporates such data to assess the current emotional tone of the market.
Traders also monitor put-call ratios, which reflect whether investors are hedging (fearful) or speculating on gains (confident). A high volume of put options suggests rising concern, while an increase in call options often signals bullish sentiment.
Advanced MMI models use natural language processing (NLP) to analyse thousands of articles, tweets, and financial news headlines. By assessing the tone—positive, neutral, or negative-it examines how people react to market events as they happen.
The number of advancing versus declining stocks gives insight into whether bullishness or bearishness is widespread or concentrated. If most stocks are climbing, the overall mood is positive.
Short-term price momentum of major indices or assets often reflects investor enthusiasm or panic. Sustained rallies point to optimism, while sharp drops can signal fear or uncertainty.

Interpreting the MMI involves understanding where it falls on its scale, typically ranging from extreme fear to extreme greed, or from bearish to bullish. Here's how traders interpret these readings:
When the index shows extreme fear, it may indicate oversold market conditions. Contrarian traders often see this as a potential buying opportunity, anticipating a market rebound as fear subsides.
A neutral score suggests a balanced market where buyers and sellers are relatively equal in conviction. In such scenarios, traders often wait for stronger signals from technical indicators or other sentiment tools before taking positions.
Extreme greed signals that market participants may be overconfident or irrationally exuberant. IT could be a warning that assets are overbought or due for a correction. Traders may take profits or prepare for potential reversals.
In each case, the MMI provides context. It's rarely used in isolation, but when combined with other data, it becomes a powerful confirmation tool.
The Market Mood Index offers several practical applications across trading styles. Here's how different types of traders might integrate it into their strategies:
Swing traders use the MMI to identify potential turning points in sentiment. If the index moves from extreme fear to neutral, it could signal a bullish reversal. Conversely, a shift from extreme greed to neutral might signal a shorting opportunity.
Real-time sentiment changes, often reflected in live versions of the MMI, help day traders anticipate short-term momentum shifts. A sudden spike in fear during intraday trading might be a cue to reduce risk or pivot to defensive strategies.
Long-term investors use the MMI as a macro-level indicator. During periods of excessive greed, they may rebalance portfolios or trim overperforming sectors. In times of fear, they may view depressed prices as opportunities for accumulation.

Let's examine how the MMI assisted traders during a real-world event—the COVID-19 market crash in March 2020.
As the virus spread globally, fear overtook markets. The MMI plummeted to its lowest levels, signalling extreme panic. While prices dropped rapidly, contrarian traders saw the index's reading as a potential capitulation point.
Soon after, central banks intervened, and markets began a historic recovery. Those who had used the MMI as part of their strategy were better positioned to re-enter when fear was highest and valuations most attractive.
This example shows that while the MMI doesn't predict catalysts, it provides vital emotional context. When paired with macroeconomic data, it can be a valuable guide.
Despite its utility, the Market Mood Index has drawbacks. First, sentiment is not always a timing tool. The market may act irrationally for longer than a trader can stay financially stable. A state of intense greed can remain for weeks before a change.
Second, the MMI is reactive, not predictive. It tells you how the market feels now, but not necessarily what it will do next. That's why it's often used in conjunction with technical or fundamental analysis.
Lastly, like any index, the MMI can be misleading in isolation. It should be one part of a broader trading toolkit that includes trend analysis, volume observation, and news awareness.
For optimal benefits from the MMI, traders must incorporate it into a wider decision-making approach. Consistently compare sentiment information with price movements and volume patterns. If the MMI shows greed but price action diverges, it could be a signal of a coming reversal.
Avoid relying on the MMI as a standalone indicator. Use it to validate other signals, not to replace them. And always remember that emotional trends in markets can shift quickly. Stay alert and revisit the MMI frequently, especially during periods of high volatility.
In conclusion, in the data-rich world of modern trading, tools like the Market Mood Index provide a psychological edge. They help traders tune into the emotional undercurrent that drives markets, often invisible in charts or news headlines alone.
While not a crystal ball, the MMI is a valuable companion to technical and fundamental strategies. It reminds us that markets are made up of people, and people are emotional.
Disclaimer: This material is for general information purposes only and is not intended as (and should not be considered to be) financial, investment or other advice on which reliance should be placed. No opinion given in the material constitutes a recommendation by EBC or the author that any particular investment, security, transaction or investment strategy is suitable for any specific person.