Volatility is a central theme in the world of trading — particularly in the energy markets, where geopolitical events, supply disruptions, and macroeconomic factors often trigger sharp price swings. To measure this uncertainty in the oil markets, traders and analysts rely on a key gauge: the Oil Volatility Index, commonly known as OVX.
Often likened to the equity market's VIX — the so-called "fear index" — OVX serves as a barometer of sentiment and risk in crude oil trading. It provides valuable insight not only into market expectations of near-term price fluctuations but also into broader energy market dynamics. In this article, we examine the OVX in depth: what it is, how it's calculated, how to interpret its levels, and how it differs from traditional volatility measures.
What Is the Oil Volatility Index (OVX)?
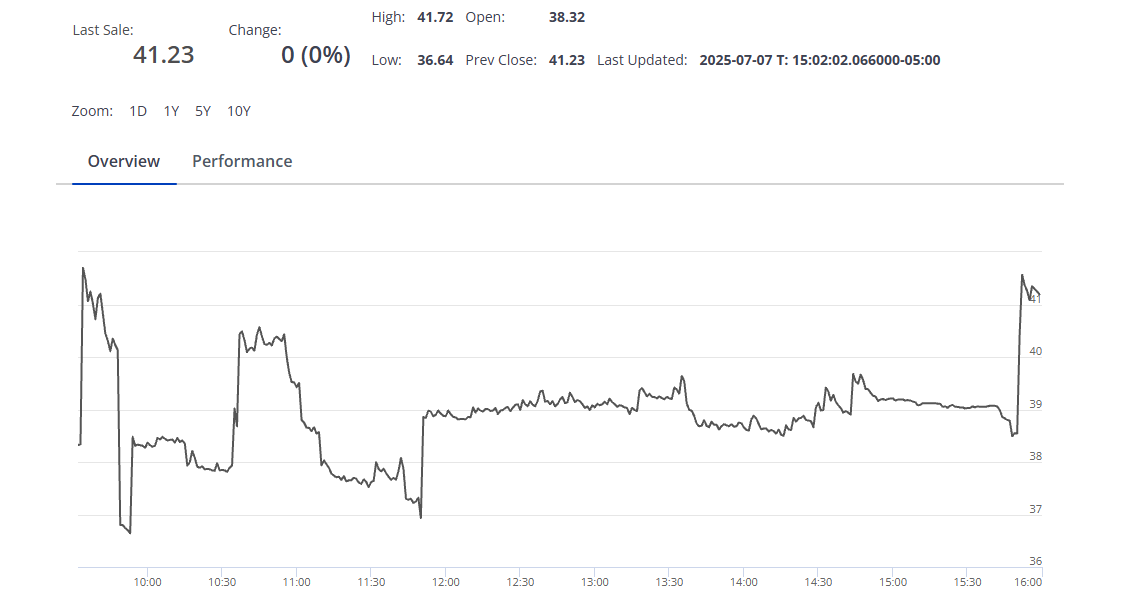 The OVX, or Oil Volatility Index, is a real-time market index that reflects the market's expectations of 30-day forward-looking volatility in crude oil prices. It is calculated using options on the United States Oil Fund (USO) — an ETF designed to track the performance of West Texas Intermediate (WTI) crude oil futures.
Introduced by the Chicago Board Options Exchange (CBOE), the OVX mirrors the methodology used in constructing the VIX. While the VIX is based on S&P 500 index options, the OVX derives its value from USO options. In essence, it translates investor sentiment — fear, uncertainty, or complacency — into a single, observable number.
As an implied volatility index, the OVX doesn't measure past price fluctuations. Instead, it gauges how volatile the oil market is expected to be over the next 30 calendar days based on option pricing models. A higher OVX implies greater expected volatility and heightened market anxiety, while a lower OVX suggests stability or subdued sentiment.
How OVX Is Calculated & What It Represents
 The OVX uses a sophisticated options pricing model derived from the VIX methodology. It combines prices of a wide range of out-of-the-money call and put options on the USO, focusing specifically on those with near-term expiration dates. The formula takes into account the implied volatilities embedded in these option premiums — effectively reverse-engineering the market's expectations.
Key points about the calculation include:
Underlying Asset: USO etf options, which reflect investor sentiment around WTI crude futures.
Time Horizon: The index targets a constant 30-day maturity.
Weighting: The model weights each strike price based on its bid-ask spread and proximity to the current price of oil.
Volatility Surface: The calculation uses a variance swap-like method to interpolate expected volatility across strikes.
What OVX represents, therefore, is a distilled view of collective market expectations regarding oil price fluctuations. It is not directional — a high OVX does not imply prices will go up or down, only that the market anticipates larger movements in either direction.
Interpreting OVX Levels
Understanding what different OVX levels mean is key to using the index effectively in trading and risk management:
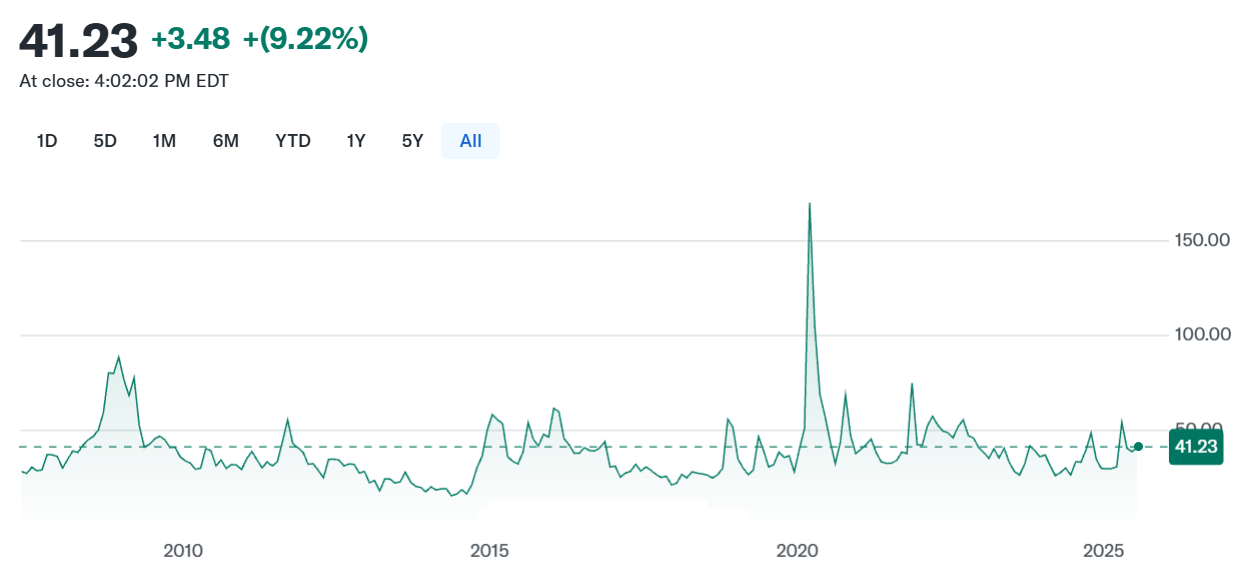
OVX below 25: This typically signals a stable oil market with muted expectations for significant price swings. Such low readings are common during periods of high supply security and economic calm.
OVX between 25–40: A mid-range level often seen during periods of moderate uncertainty, including OPEC meetings or soft geopolitical tension.
OVX above 40: This range is associated with heightened volatility, driven by geopolitical shocks (e.g. Middle East conflict), global recessions, or dramatic changes in supply/demand outlook.
Extreme spikes (above 60): Historically rare, these readings tend to coincide with systemic shocks like the COVID‑19 oil crash or the 2008 financial crisis.
It's also crucial to look at the rate of change in OVX — a rapid jump may reflect a sudden event or panic, even if the absolute level is still moderate. OVX is particularly useful when read in conjunction with oil price trends, trading volume, and open interest data.
OVX vs Historical Volatility
One of the biggest distinctions in volatility analysis lies between implied volatility (as captured by OVX) and historical (or realised) volatility, which is computed from past price movements.
Historical Volatility measures how much oil prices have fluctuated over a given time period (e.g. 20 or 60 trading days).
Implied Volatility, on the other hand, is forward-looking. It reflects market expectations and often reacts faster to breaking news or shifts in sentiment.
The gap between implied and realised volatility can be telling:
When implied volatility is much higher than realised volatility, it may signal market anxiety or risk premium — potentially useful for contrarian trades or volatility selling strategies.
When realised volatility catches up or overshoots implied volatility, it may validate market concerns and suggest further trend continuation.
For example, during a period of oil price stability, if OVX begins to rise sharply, it might indicate that traders are bracing for a potential disruption — perhaps in anticipation of OPEC decisions or military tensions.
Practical Uses of OVX
The OVX can serve a variety of purposes for different market participants:
For Traders:
Use OVX as a sentiment gauge to adjust position sizes or avoid overexposure during high-risk periods.
Develop volatility-based strategies such as straddles or strangles in options trading.
Monitor OVX trends to identify potential reversal zones or breakout setups in crude oil.
For Hedgers:
Producers and refiners can monitor OVX when planning hedging operations to secure prices amid volatile market conditions.
A rising OVX may justify tighter hedges, while a falling OVX might offer more cost-effective protection.
For Analysts & Portfolio Managers:
OVX provides a window into macro sentiment, especially when oil is influencing inflation expectations or global growth assumptions.
Including OVX in broader risk models can help assess exposure to commodity-linked assets and inflation hedges.
Ultimately, the OVX is a versatile tool — useful not just for oil traders, but for anyone managing portfolios with commodity exposure or macro sensitivity.
Conclusion
The Oil Volatility Index (OVX) is much more than a simple number. It encapsulates market anxiety, forecasts about future price movement, and insight into how traders are positioning around risk. For those operating in the energy space — whether as traders, analysts, or hedgers — understanding how to interpret and apply the OVX is invaluable.
As with any volatility index, OVX is best used in conjunction with broader market data and a disciplined trading approach. When viewed through the right lens, it can become a powerful tool for anticipating risk and navigating the often unpredictable tides of the oil markets.
Disclaimer: This material is for general information purposes only and is not intended as (and should not be considered to be) financial, investment or other advice on which reliance should be placed. No opinion given in the material constitutes a recommendation by EBC or the author that any particular investment, security, transaction or investment strategy is suitable for any specific person.


 The OVX, or Oil Volatility Index, is a real-time market index that reflects the market's expectations of 30-day forward-looking volatility in crude oil prices. It is calculated using options on the United States Oil Fund (USO) — an ETF designed to track the performance of West Texas Intermediate (WTI) crude oil futures.
 The OVX uses a sophisticated options pricing model derived from the VIX methodology. It combines prices of a wide range of out-of-the-money call and put options on the USO, focusing specifically on those with near-term expiration dates. The formula takes into account the implied volatilities embedded in these option premiums — effectively reverse-engineering the market's expectations.


