Published on: 2026-02-11
Global oil markets are displaying a peculiar nervousness in early 2026, and the reason can be traced to two interconnected developments: a chokepoint that handles one-fifth of the world's oil and a record stockpile of Iranian crude floating at sea, waiting for buyers.

The Strait of Hormuz, a narrow waterway between Oman and Iran, carries enormous weight in global energy security. According to the US Energy Information Administration (EIA), approximately 20 million barrels per day flowed through this strait in 2024, representing roughly 20% of global petroleum liquids consumption. For context, this means that one in every five barrels consumed worldwide passes through this 33-kilometre-wide passage.
The strait matters not just to major importers like China, India, Japan, and South Korea, which together accounted for 69% of all Hormuz crude flows in 2024, but to the entire global pricing mechanism. When tensions rise in this region, Brent crude, the international benchmark, responds swiftly. A single headline suggesting potential disruption can reprice oil futures before any actual supply is lost. This sensitivity explains why any escalation between the United States and Iran creates immediate ripples across global markets, affecting everything from petrol prices in London to diesel costs in Mumbai.
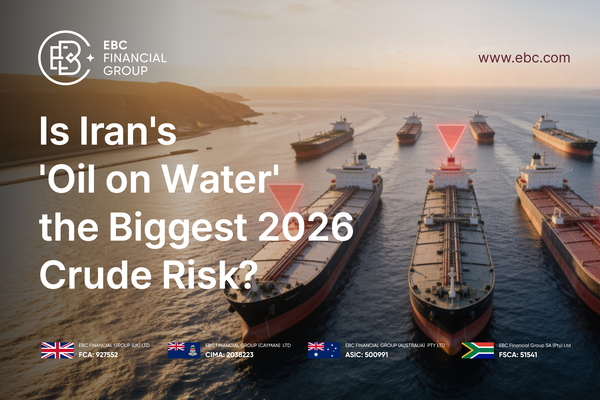
Running parallel to the Hormuz risk is a less visible but equally important development: Iran has accumulated a massive floating stockpile of crude oil. Reuters reported in January 2026 that shipping trackers estimated between 166 and 170 million barrels of Iranian crude and condensate currently sit on tankers, representing roughly 50 days of Iran's production. Nearly half of this floating inventory has been flagged near Singapore and Malaysia, key hubs for ship-to-ship transfer operations.
This phenomenon, which traders call "oil on water," transforms how markets interpret geopolitical risk. Unlike a traditional supply disruption where barrels simply vanish from the market, floating storage creates ambiguity. These barrels exist, but their availability is uncertain. They might discharge next week, flooding the market with late supply. Or they might remain stuck for months, effectively removing them from the global balance sheet. This uncertainty amplifies price volatility because the market must constantly reassess not just whether barrels will flow through Hormuz, but whether Iran's offshore stockpile is growing or shrinking.
The complexity of this setup became apparent in late January 2026. On 28 January, Brent crude was trading around $67.85 per barrel, supported by a winter storm disrupting US supply and lingering Middle East tensions. The following day, prices surged to a five-month high as concerns intensified that Washington might take military action against Iran, potentially threatening flows through Hormuz.
However, by early February, the market began to unwind some of those gains. Reuters reported on 8 February that oil prices dropped more than 1% after US-Iran talks concluded in Oman, easing immediate conflict concerns. Yet just hours later, prices rebounded after the US Maritime Administration urged caution for commercial vessels travelling near Iranian waters.
These rapid reversals illustrate the market's central dilemma: pricing a tail risk that has not materialised while simultaneously tracking a stockpile whose ultimate destination remains unclear. For traders worldwide, this creates both opportunity and peril. The premiums can evaporate as quickly as they appear, making timing critical.
The fate of Iran's floating barrels hinges predominantly on one buyer: China. According to Kpler data cited in reporting, China purchased more than 80% of Iran's shipped oil in 2025, averaging approximately 1.38 million barrels per day. This concentration creates a unique dependency where Iranian export dynamics are largely shaped by Chinese demand conditions.
The primary buyers are independent refiners known as "teapots," mostly clustered in China's Shandong province. These smaller refiners operate on tight margins and are attracted to Iranian crude because it trades at steep discounts, often $4 per barrel or more below Brent. However, their purchasing capacity is constrained by government-imposed import quotas, financing availability, and the practical difficulties of moving sanctioned crude.
Recent developments highlight this constraint. In early February 2026, Reuters reported that Iranian oil stored on tankers in Asia had dipped to 41.72 million barrels from 46.25 million barrels, suggesting some clearance was occurring as Chinese teapots used fresh import quotas. This drawdown in floating storage can act as a pressure release valve, capping price rallies when the market fears a squeeze.
But the "China gate" can close just as quickly. When teapots exhaust their quotas, encounter financing difficulties, or face regulatory scrutiny, Iranian barrels accumulate at sea. This dynamic means that traders monitoring this risk must track not just geopolitical headlines, but also Chinese refinery run rates, quota allocations, and the discount spreads that make Iranian crude attractive despite the sanctions risk.
Beyond the numbers, shipping logistics provide real-time indicators of market stress. When geopolitical tensions escalate, commercial shipping responds with caution. Reuters documented in January 2026 that dozens of ships anchored outside Iran's port limits as US-Iran tensions rose. This behaviour is not mere prudence; it translates directly into delays, and delays are what ultimately get priced into the forward curve.
The Singapore cluster serves as a particularly useful barometer. When the number of Iranian-linked tankers waiting near Singapore and Malaysia grows, it signals congestion in the system. This congestion can stem from multiple sources: ships waiting for buyers, cargoes awaiting ship-to-ship transfers to obscure origin, or delays in obtaining discharge slots. Conversely, when the cluster shrinks, it suggests the system is clearing and that supply is finding its way to refineries.
For traders globally, this means that attention to seemingly mundane logistics data, such as the number of vessels at anchor or the waiting time for berths, can provide early warning signals before official export statistics are published. These indicators matter because they reveal whether fear premiums are justified by actual supply tightness or whether they represent temporary noise that will fade.
Beneath the headline volatility lies a fundamental view that is considerably more bearish. The EIA's January 2026 Short-Term Energy Outlook projects Brent crude to average $56 per barrel in 2026, down from 2025 levels, and $54 per barrel in 2027. This forecast is built on an expectation that global oil production will exceed demand, causing inventories to build by an average of 2.8 million barrels per day in 2026.
The EIA's outlook assumes that growing production from non-OPEC sources, particularly from the Americas, will outpace consumption growth. If this scenario unfolds, it creates an environment where geopolitical fear premiums struggle to persist. In an inventory-building market, traders are less willing to pay for tail risk because physical tightness is absent. Spikes can still occur, but they tend to burn quickly unless confirmed by actual supply loss.
This baseline matters enormously for traders considering medium-term positions. A market expecting rising inventories is fundamentally different from one expecting deficits. In the former, rallies often represent selling opportunities; in the latter, dips may be worth buying. Understanding where the market sits on this spectrum helps frame whether Iran-related volatility is likely to produce sustained moves or quick reversals.
Conventional supply disruptions follow a straightforward logic: production stops, inventories draw, and prices rise until demand is rationed or alternative supply emerges. Iran's floating stockpile disrupts this script. These barrels are neither fully available nor entirely unavailable. They exist in a grey zone where their clearing depends on factors, such as sanctions enforcement intensity, Chinese quota policy, and financial market access, that can shift suddenly.
This creates a scenario where Brent can spike on fear of disruption, only to retreat when market participants realise that floating barrels could land if conditions allow. Conversely, periods of calm can suddenly tighten if those floating barrels fail to clear and China's gate narrows. The result is a market prone to false signals and whipsaws, particularly challenging for shorter-term traders.
Traders seeking to navigate this environment can focus on several concrete indicators that cut through the noise:
Floating storage levels: Weekly tanker-tracking data from services like Kpler and Vortexa show whether Iran's oil on water is accumulating or declining. A sustained rise suggests barrels are stuck; a sustained fall indicates clearance.
Singapore and Malaysia anchorage data: The number of tankers waiting near these hubs provides a real-time snapshot of system congestion. Growth in this cluster typically precedes tightening; shrinkage suggests easing.
Chinese teapot activity: Reports on refinery run rates, fresh quota allocations, and purchases of Iranian crude at discount indicate whether the primary demand source is active. Quota exhaustion or regulatory clampdowns signal potential barrel accumulation.
Shipping route adjustments: Changes in vessel routing, increased time at anchor outside Iranian ports, or insurance and financing difficulties all point to friction that can delay discharge.
Hormuz incident reports: Any reports of vessel interference, military manoeuvres, or official warnings near the strait itself create immediate repricing risk and should be monitoredclosely.
Follow-through after spikes: The critical test of any geopolitical rally is whether it holds for multiple sessions. Single-day spikes that fade quickly suggest the market is not convinced of sustained disruption.
Rather than attempting precise forecasts, traders may find it more useful to think in terms of scenarios and their corresponding price ranges. These are illustrative frameworks, not predictions or recommendations.
Citi has said further escalation could lift Brent into the low $70s, while Kpler/Vortexa tracking cited by Reuters shows Iran’s oil on the water at record highs, with unloading difficulties contributing to the build.
This scenario assumes the market prices a persistent risk premium because supply tightness appears credible.
If tensions ebb and floating storage begins to draw down consistently, indicating barrels are clearing through the China gate, Brent would likely gravitate towards the high $50s to mid-$60s range. This aligns more closely with the EIA's baseline inventory-build outlook.
If an actual disruption occurs, whether through military action affecting Hormuz flows or a sharp sanctions crackdown that genuinely halts Iranian exports, prices could move well above $70, potentially reaching $80 or higher depending on the scale and duration. However, for such moves to persist, the disruption must be confirmed and sustained, not merely feared.
If the market's attention shifts away from Iran and towards the inventory-build narrative, with floating storage clearing and no Hormuz incidents, Brent could test the mid-$50s levels that the EIA projects as the 2026 average.
These scenarios are not mutually exclusive and can transition rapidly. The key is recognising which one the market is currently pricing and whether new information supports or contradicts that view.
While this analysis focuses on crude oil dynamics, the implications extend far beyond energy markets. Oil price volatility affects inflation expectations, which influence central bank policy decisions worldwide. For traders in currencies, bonds, and equities, a sustained spike in Brent can shift the entire risk landscape.
Emerging market currencies, particularly those of oil importers like India, Turkey, and several Southeast Asian economies, face pressure when energy costs rise. Conversely, oil exporters benefit from higher prices, supporting their currencies and fiscal positions. Understanding the Iran-Hormuz-China dynamic therefore provides context for positioning across multiple asset classes.
For CFD traders specifically, the leverage inherent in these instruments means that oil volatility can create both significant opportunities and substantial risks. The ability to go long or short allows traders to express views on both the upside and downside scenarios outlined above, but it also means that incorrect timing or sizing can lead to rapid losses.
As of early February 2026, Brent has been trading in the high $60s range, with futures closing at $69.04 per barrel on 9 February following a 1.45% gain. This pricing suggests the market is carrying a modest geopolitical premium above the EIA's $56 baseline forecast, but not pricing imminent catastrophe.
The price action reflects a market that acknowledges the Iran risk but is not convinced a major disruption is imminent. Hedge funds have increased bullish oil bets to multi-month highs, indicating that speculative positioning leans towards expecting higher prices. However, the fact that Brent remains below $70 despite heightened tensions suggests scepticism about whether premiums will prove durable.
This positioning creates its own dynamics. If a genuine disruption materialises, the rush to cover short positions and establish long exposure could amplify the move. Conversely, if tensions continue to ebb and flow without material supply impact, long positions may be liquidated, accelerating any decline towards the EIA's baseline.
Iran's oil on water is undoubtedly one of the most significant crude oil risks facing markets in 2026. The combination of Hormuz chokepoint exposure and record floating storage creates a unique setup where both supply shortage and surplus scenarios remain plausible depending on how China's demand, US sanctions policy, and regional geopolitics evolve.
What makes this risk distinctive is its ambiguity. Traditional supply disruptions offer clarity: either production stops or it does not. The oil-on-water dynamic offers no such certainty. Barrels are simultaneously at risk and potentially available, creating a market environment where volatility is elevated but direction is unclear.
For traders globally, this environment rewards those who can distinguish between noise and signal, who track the concrete indicators of system stress rather than reacting solely to headlines, and who manage risk carefully in recognition that reversals can be swift. It also underscores the importance of understanding why seemingly distant geopolitical developments, such as quota decisions by Chinese bureaucrats or shipping delays in Southeast Asian waters, can materially affect trading conditions from London to Lagos.
Whether Iran's floating stockpile ultimately proves to be 2026's biggest crude risk will depend on factors that remain genuinely uncertain as of February 2026. What is certain is that this dynamic will continue to drive volatility, create trading opportunities, and demand close attention from anyone exposed to energy markets or the broader asset classes they influence.
Looking to trade XBRUSD? Trade with EBC, the World’s Best* Broker.
*3 Consecutive Years of Recognition From World Finance: Best FX Trading Platform 2023, Best CFD Broker 2024, Best Trading Platform 2025, Most Trusted Broker 2025. Online Money Awards Best CFD Provider 2025.
Disclaimer & Citation
This material is for information only and does not constitute a recommendation or advice from EBC Financial Group and all its entities ("EBC"). Trading Forex and Contracts for Difference (CFDs) on margin carries a high level of risk and may not be suitable for all investors. Losses can exceed your deposits. Before trading, you should carefully consider your trading objectives, level of experience, and risk appetite, and consult an independent financial advisor if necessary. Statistics or past investment performance are not a guarantee of future performance. EBC is not liable for any damages arising from reliance on this information.