Published on: 2024-02-23
Updated on: 2024-07-11
In trading, there is a very basic probability of support and pressure. There is a tendency for the price not to break through a previous horizontal level. This concept is very easy to understand, but in actual trading, it is very useful to help investors set reasonable stop losses, take profit, or add or subtract points. Here we will take a closer look at the calculation and application techniques of support levels.
 What is Support Level?
It refers to the price level or area where the price of a stock or other asset may encounter buying support during a decline. This price level is usually considered attractive because investors are willing to buy the asset at this price level, thus preventing the price from falling further.
A support level is a price level near which prices tend to stop falling or rebound during a stock's decline. It is usually a price level that is considered in technical analysis to have a certain strength that prevents or temporarily stops the price from continuing to fall, making it more likely that the price will rebound or consolidate in that position.
Support is usually formed due to the presence of more buyers at this price level, allowing the price to be supported at this level. It can be a combination of several factors, such as historical price action, moving averages, trend lines, volume, and so on.
It can be categorized into psychological and substantial support. The so-called psychological support is that once the price reaches a certain position, people's psychology will produce some subtle changes. For example, when drawing a Trend Line for trading, it is an upward-long market. Then, when the price is near a trend line, it will produce a support effect. And this will allow some people to produce some psychologically subtle changes, that is to say, a psychological support level.
This psychological support can also be reflected by some indicators, such as the Bollinger Band. Its upper edge is generally understood as a pressure level, while the lower edge is considered to have some support. But because it does not mean that after the price breakout, it will necessarily stop in a long-trend market, it can only be treated as psychological support.
Substantial support is a special price range in which both sides are willing to make bids and then trade. For example, you can draw a group of averages to see the dense area of the averages, where the averages are crossed and dense, which is a substantial support.
By drawing a box around the area of concentration, this area will become a support area for the rest of the market. We can see that indeed, when the price goes up and comes back down after a period of trading, the price is supported in this area because it is an area of intense trading.
In technical analysis, the support level can be determined not only through the averages but also by looking at the historical price charts. If the stock price in the past has repeatedly touched and rebounded, these price levels may become the future support level.
Support levels can also be determined by drawing trend lines. First, identify a possible downtrend line that may have existed during the decline of the stock price. When the stock price touches this trend line, there is a possibility that support may emerge, resulting in a rebound. At the same time, observe the volume in the process of stock price decline. If the volume is enlarged but the stock price does not continue to fall, it often indicates that there are more buyers at the price level in the field, forming a support level.
In summary, the support level is the stock price in the process of falling. A certain strength of the price level can prevent or temporarily prevent the stock price from continuing to fall, so that the stock price is in the position of rebounding or having the possibility of finishing. The judgment of support can be combined with a variety of technical analysis methods for a comprehensive analysis.
| Elements | Description |
| Definition | Main support is the strongest level of support during a price decline. |
| Forming factors | Historical prices, volume, and technical indicators are key factors. |
| Function | Key for timing purchases and setting stop-loss levels. |
| Characteristics | A rebound or stop is often seen when the price stEPS back into support. |
| Importance | Of significant importance in technical analysis and trading decisions. |
Generally speaking, the confirmation of support and resistance levels requires a certain amount of experience and skill. That is, through the historical data or technical analysis methods to make an inference, and then really the actual transaction many times to verify, in order to get a certain degree of accuracy of the support and resistance levels.
However, some masters have summarized the formula, which allows for a relatively quick and simple determination of the support level. For example, many people feel that the wave theory is too complicated; to retain the wave theory at the same time is to extend it out of the formula. Not only does it give a better understanding of wave theory, but it also makes it easier for traders to find support and pressure levels on a daily basis.
The formula is very simple and is divided into two steps. The first step is to find a stock market chart. In the last wave of the market, set a low point that is a, and in this wave of the market, set a high point that is b. The second step is to find the high point b minus the low point a, and then divide by 3. plus the low point a.
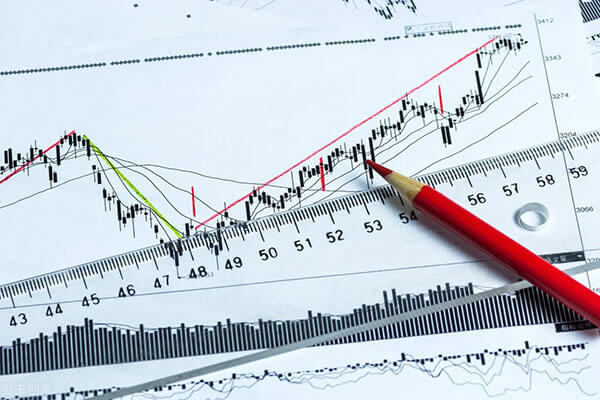
For example, in the first wave of the rise, its lowest point is at 5.1. Then the entire stock price began to start the uptrend to the high point of 7.44 and began to fall back. Using the formula just described, you can calculate that its support level is 7.44. then subtract 5.1. then divide by 3. and finally add 5.1. The result is 5.88.
The result is 5.88. Then again, for example, in practice, in the following EUR/USD, its lowest point is 1.2187. that is, the red line position. The highest point is 1.2534. That is, the green line above. Then, according to the formula, you can get 1.2303 from this support line, that is, the green line S1.
 With the use of such a formula, which directly calculates the level of support for the stock, the trader does not have to hold a position on whether to go or stay. However, it is important to note that it is important not to get too carried away with these values, as all techniques are not 100% accurate.
It is enough to know the approximation of it, because this itself is a range reference. Whether it is the support level or pressure level of the stock price, do not pursue too much to the penny. For example, the support level was just calculated at 1.2303. If it is 1.2302 or 1.2301. this time to trade is no problem; it does not have to be completely accurate to a minute and a centimeter.
Once the support level is identified, the next step is to capitalize on it effectively. This involves buying at the support level when prices are relatively favorable and selling when they rise, aiming for a profitable outcome. Utilizing support levels for buying and selling is a fundamental strategy in technical analysis.
However, the success of this strategy hinges on accurately assessing the strength of the support level. This assessment considers both the tangible costs associated with holding the stock and psychological factors, which collectively influence the robustness of each support level. It's important to note that substantial support, backed by tangible factors, typically holds more strength compared to support driven primarily by psychological factors. Ideally, when these factors align and reinforce each other, the support level is at its strongest.
At the same time, it cannot rely too much on the strength of the support pressure or needs to be combined with a real-time K-line Pattern to operate. As the price approaches support levels and begins to rally, other indicators or signals need to be confirmed to support buying. This may include price pattern patterns (e.g., double bottom pattern), signals from technical indicators (e.g., Relative Strength Indicator, MACD, etc.), etc.
And when the price approaches that level, be sure to start watching the market for a reaction. This is when an increase in buying may occur, and this is because many investors may believe that the price is near the bottom and worth buying. Generally speaking, if you see huge volume at the support level attachment, then that support is very strong. However, it is important to note that a drop below support does not necessarily require volume.
It is also important to note that when looking for support levels to trade, you should also look for pressure levels at the same time. This is because the two are interchangeable, with the previous support level becoming the subsequent pressure level once it has been broken, and vice versa.
It is also important to note that before opening a position, the support level of the disk should be carefully analyzed. When determining to buy, you should also set a target price, that is, the desired level of profit. There should be a good profit-loss ratio before you choose to enter. A stop-loss level should also be set at the time of buying to control potential losses. The stop loss level can be set in the appropriate position below the support; once the price breaks through the stop loss level, there should be a timely stop loss exit.
Special advice: never to the set after the analysis of the support level, in which the analysis has actually not much significance. If you can't figure out the stop loss and profit before opening a position, don't open a position.
| Key Points | Explanation |
| Support Pressure Strength | Position strength varies and requires real-time K-line analysis. |
| Support pressure conversion. | Support breaks and becomes pressure, and vice versa. |
| Combined with volume | High support pressure, especially at key psychological levels. |
| Substantial support pressure | Strong support pressure, particularly at key psychological levels. |
| Setting take profit and Stop Loss | Set up before opening positions to avoid emotional operations. |
| Moving: Take Profit and Stop Loss | Apply dynamic take-profit and fixed stop-loss. |
Disclaimer: This material is for general information purposes only and is not intended as (and should not be considered to be) financial, investment, or other advice on which reliance should be placed. No opinion given in the material constitutes a recommendation by EBC or the author that any particular investment, security, transaction, or investment strategy is suitable for any specific person.


World's Best Broker