Published on: 2023-11-22
All walks of life have their own theories; physics has quantum theory, and economics has inflation theory. The stock market also has a variety of theories, one of which is called the box theory.
 Box theory is the formation of price fluctuations in the price range into a square box and as such to predict the stock price trend, to guide the actual operation of the technical theory. Specifically, it is on the K chart of the stock in a period of time the highest price as the box top, the lowest price as the bottom of the box, drawn as a square box.
When the stock price rises to the top of the box, usually due to some investors selling the stock and briefly retracing, the top of the box has become the stage of the stock price's upward pressure level. Similarly, when the stock price falls to the bottom of the box, it will be supported by the buyer's power and rebound; at this time, the bottom of the box has become the support level of the falling stock price.
It is believed that the period of price fluctuation in the box is the stock consolidation stage. And once the stock price breaks through the box top pressure level into a higher level of the box, it is a better time to buy. Conversely, when the stock price falls below the box support level, it moves into the next box, corresponding to the selling point. The overall price action of a stock can be divided into a combination of boxes. The top of the previous box may be the bottom of the next box, and vice versa.
In practice, the theory is more valuable in a bull market. According to its theory, if the stock price continues to rise every time an upward breakout occurs, buy signals can be issued, giving investors more opportunities to enter. And once the stock price falls below the bottom of the box, investors can sell in time to take profits. In contrast, its application in bear markets is more limited.
| Type | Description |
| Box | The price of a stock may fluctuate alternately within a horizontal range over a period of time. |
| Box top | Maximum price that alternates within a box over a period of time |
| Box Bottom | The lowest price that alternates within a box over a period of time. |
| Breakout | Breakout above the box is a buying opportunity; conversely, a drop below signals a selling point. |
Who invented it?
This theory was invented in the early 1960s by dancer Nicholas Davas.
Born in 1920 in Budapest, Hungary, Nicholas Davas fled to Turkey in 1943 due to the Nazis in Germany and then danced for a living in Europe with his half-sister.
In 1952. when he was 32 years old, he went dancing at one of the Smith Brothers' clubs. They paid him 6.000 shares of stock for the dance. At the time, that stock was $0.50 per share. Afterwards, he forgot to exchange the stock, and then some time later, he found that the stock had risen to $1.90. or almost tripled. Then he made $8.000 directly from it.
At this time, he realized that it was possible to make money through stocks. Although he was ignorant of the stock market and had no idea what it was, But he began to read and learn like crazy in 1957. In 1958. these two years on the market earned 2 million dollars.
This took Wall Street by storm, and Time magazine interviewed him about it. I asked a lot of questions and was skeptical about the authenticity of his making $2 million. After he wrote this book, How I Made $2 Million in the Stock Market (How I Made $2 Million in the Stock Market), this book summarizes his investment strategy for the box theory.
Box Theory Illustration
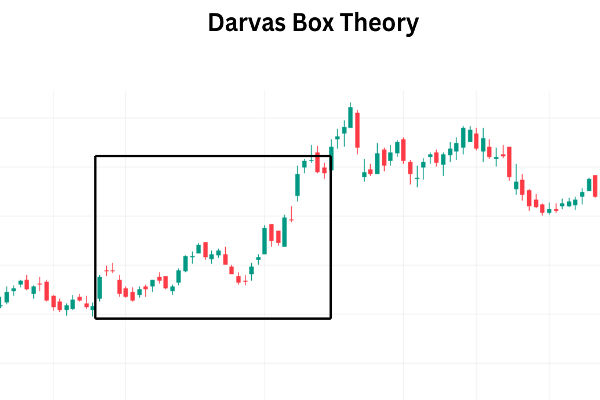
It is a method of technical analysis that focuses on the fluctuations in Stock Prices over a certain time frame and attempts to predict future price trends by analyzing these price fluctuations. As shown in the chart:

Time Axis: The horizontal axis represents time, usually measured in days, weeks, or months. Each point represents a different time period.
Price Axis: The vertical axis represents the price of a stock.
Box: In the illustration, you can see the blue area where the price fluctuates within a horizontal range over a specific period of time. This horizontal range is the so-called "box".
Upper and Lower Limits: A box is usually defined by the upper (top of the box) and lower (bottom of the box) limits of the price. The price fluctuates between these two levels.
Breakout: When the price breaks through the upper or lower limit of a box, this is considered an important signal. In the chart, there are two types of breakouts: up breakouts (price breaks through the upper limit of the box) and down breakouts (price breaks through the lower limit of the box).
Once a breakout occurs, analysts or traders usually use technical indicators or analytics to predict the target level of the price, such as the possible rise or fall after the breakout. Based on the theory, traders can adopt different strategies, such as waiting for the breakout to take action or using other technical analysis tools to aid in decision-making.
What is the essence of the box theory?
The essence of the theory is to observe and analyze price movements in order to identify important trends and key support and resistance levels in the market. It emphasizes price fluctuations over a certain time frame and attempts to provide insights about future price movements. Core Points:
Watching the Box: Using price boxes as the basic unit of analysis, these boxes are usually defined by horizontal support and resistance lines. The price fluctuates between these two levels, forming a box.
Breakout Signals: Attention is given to price breakouts, where the price breaks above or below the upper or lower limits of the box. These breakouts are often seen as signals that an important change in price has occurred. An upward breakout indicates that the price may rise, while a downward breakout indicates that the price may fall.
Target Price: Once a breakout occurs, analysts typically use a variety of technical indicators and analytical methods to estimate the target level of the price, thus providing investors with a basis for buying or selling decisions.
Trading Strategies: Based on this theory, traders can develop different trading strategies, such as taking action after a breakout occurs or using a combination of other technical analysis tools to assist in decision-making.
risk management: As with all technical analysis methods, risk management is crucial to this theory. Investors are often required to set stop-loss and take-profit levels to control risk and protect capital.
It lies in analyzing market price fluctuations as a series of boxes and focusing on price breakouts to predict future trends. It is an effective method of technical analysis that can be used to analyze prices in stocks, futures, and other financial markets.
| Type | Description |
| Horizontal Box | Prices fluctuate within a range of relatively stable levels over a certain period of time. |
| Incremental box | Widening price range signals potential upward trend and possible price increases. |
| Decreasing box | A narrowing price range, forming a descending trend that could result in a decline. |
| Cheap Box | Price instability without a clear trend, common in uncertain markets. |
| Box Continuum | Repeated entry into a specific price range signifies a persistent market trait. |
| Flag Box | Swift price change followed by a tight range signals short-term trend support. |
| Deterministic Box | Horizontal price swings in long-term trends with defined support and resistance lines. |
| Wave Box | Fluctuating prices without a clear trend, indicating potential market uncertainty. |
Is it useful?
It is a technical analysis method used by many investors to analyze stock price fluctuations and try to predict future price trends. It can provide some useful insights, but it also has its limitations, and its advantages and limitations are listed below:
Its strength lies in the simplicity of the theory, which does not require complex math or calculations. Investors can easily draw box plots using hand-drawn or computerized graphics software, which makes it a viable technical analysis method for beginners and non-professional traders. And the rate emphasizes price breakouts, which are often seen as signals of important price changes. It helps investors determine when to enter and exit the market. It also helps capture market sentiment and the cyclical nature of price movements. By observing changes in the box, investors can understand the balance of power among market participants.
The limitation is that the theory is sometimes subjective in its interpretation and analysis. Different analysts may reach different conclusions about the same graph, which can lead to inconsistent trading decisions. And it focuses mainly on price fluctuations, ignoring factors related to company fundamentals, such as financial data and economic indicators. This may limit our understanding of the full picture of the market.
And it doesn't provide an accurate price prediction; it can only provide an approximate price range. Therefore, it is not a fully accurate tool and cannot completely eliminate risk. So it may not be applicable to all markets and all time periods. Certain markets may not have a typical box pattern, and the usefulness of box theory may be diminished under rapidly changing market conditions.
Disclaimer:This material is for general information purposes only and is not intended as (and should not be considered to be) financial, investment, or other advice on which reliance should be placed. No opinion given in the material constitutes a recommendation by EBC or the author that any particular investment,security, transaction, or investment strategy is suitable for any specific person.


World's Best Broker