Understanding the USDJPY correlation with U.S. and Japanese stocks can transform your trading. This pair, with 17% of Forex volume, moves in sync with equity markets. The USDJPY correlation reflects economic ties—strong stocks often lift it, weak ones drag it down.
In a $6 trillion daily market, per 2022 BIS, grasping this link is key. Let's unlock how stocks drive USDJPY correlation and how to trade it.
What Is USDJPY Correlation?

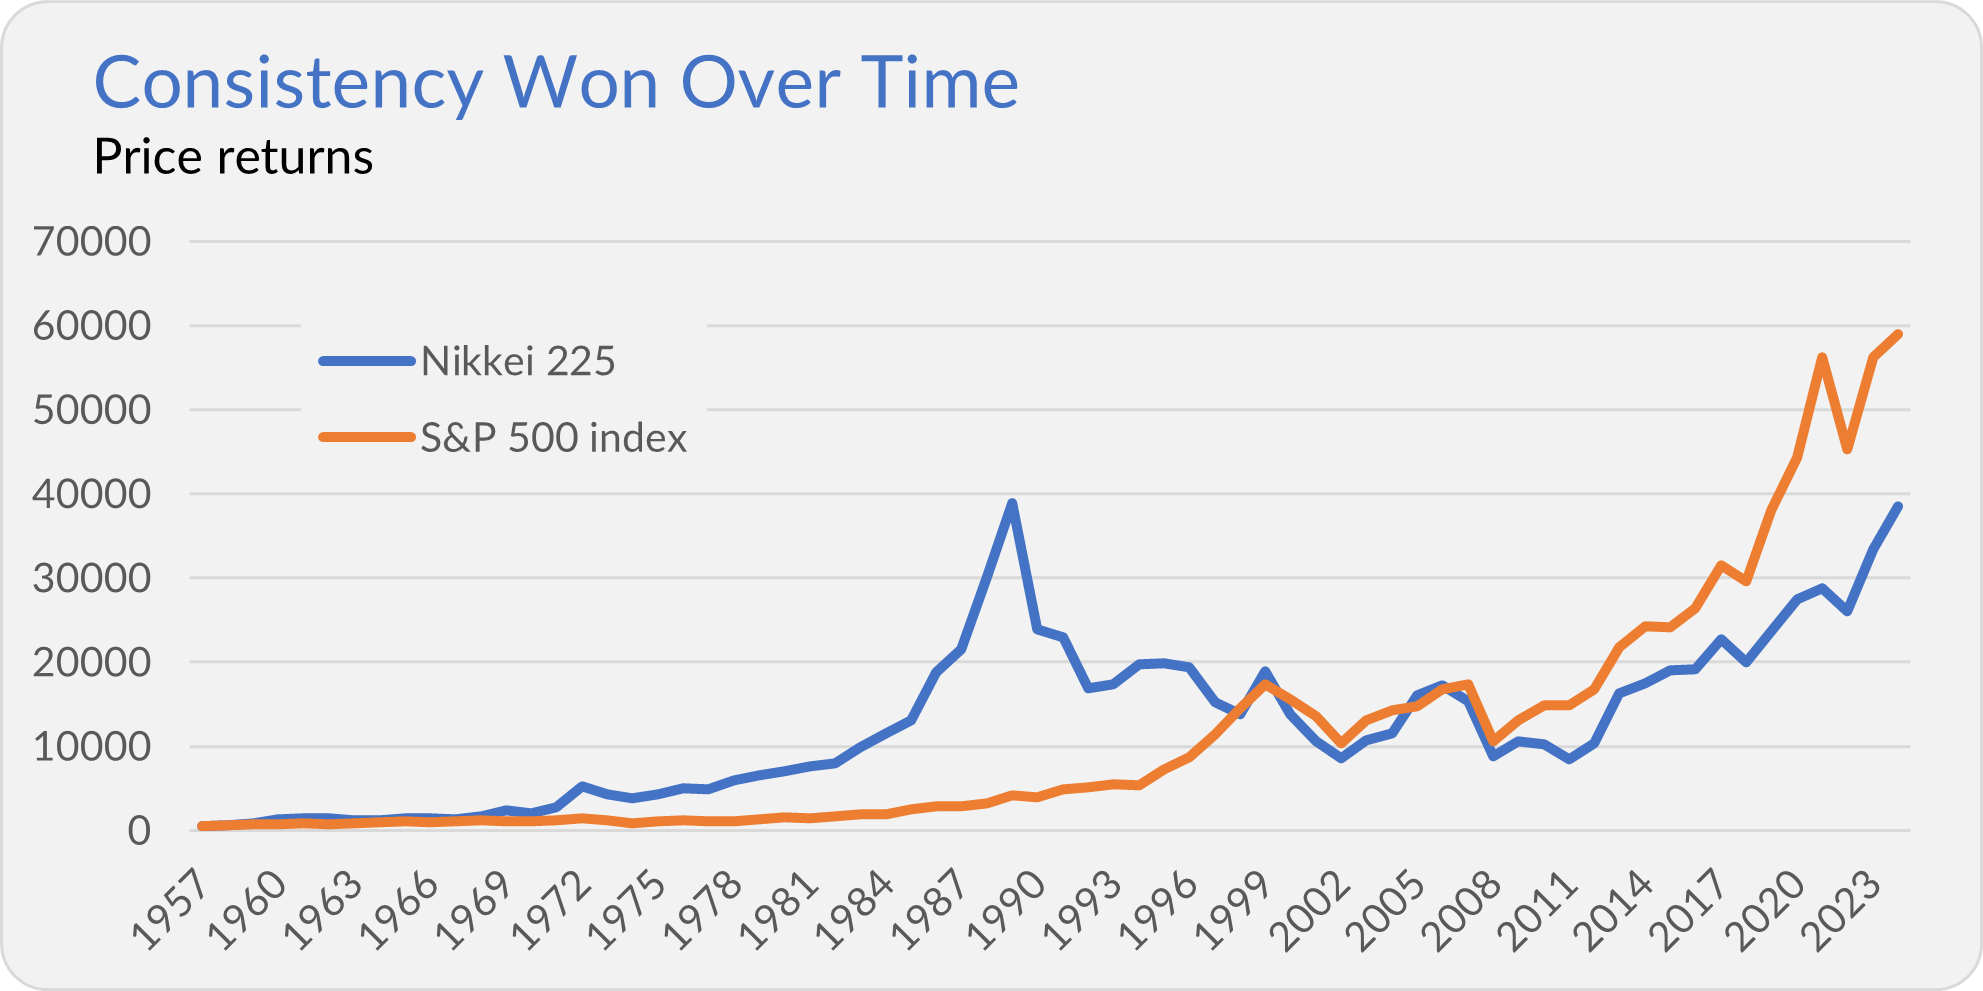
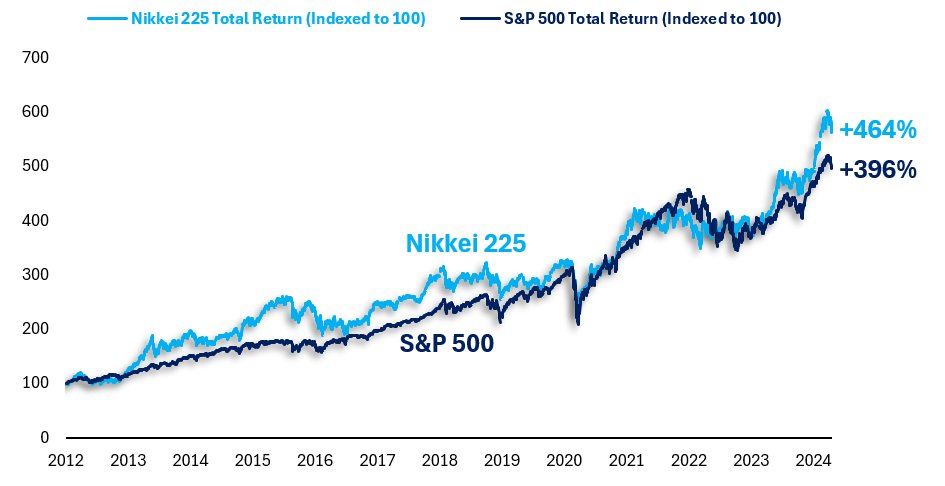
USDJPY correlation measures how this pair aligns with other assets. It's positive with U.S. equities and Japan's Nikkei 225. When stocks rise, USDJPY often follows—up 5% in 2023 alongside S&P 500 gains. It's a dance of risk and reward.
USDJPY and U.S. Equities
The USDJPY correlation with U.S. stocks is tight. A booming S&P 500 signals risk-on sentiment, boosting the dollar. In 2024, a 10% S&P rally matched a 7% USDJPY rise, per Bloomberg. Weak stocks flip it—yen strengthens as a safe haven.
USDJPY and Japanese Stocks
Japan's Nikkei 225 also ties into USDJPY correlation. A strong Nikkei reflects export confidence, weakening the yen. In 2023, Nikkei's 8% climb saw USDJPY hit 150. But a yen surge—5% in a risk-off week—tanked stocks and the pair.
USDJPY Correlation Stats
| Asset |
Correlation |
2023 Move Impact |
| S&P 500 |
+0.75
|
+10% = +7% USDJPY |
| Nikkei 225 |
+0.65 |
+8% = +5% USDJPY |
| U.S. 10-Yr Yield |
+0.80 |
+1% = +3% USDJPY |
How It Works
The USDJPY correlation with stocks hinges on sentiment. Bullish U.S. markets draw capital, lifting the dollar. Japanese export stocks thrive with a weaker yen—90% of Toyota's profits rely on it, per 2023 data. Bearish times reverse this.
Other Currency Pair Links
USDJPY correlation extends to pairs. It's positive with SGD/JPY (+0.70) and EURSEK (+0.60), per 2024 FXCM stats. It's negative with GBPUSD (-0.65)—a GBPUSD drop often lifts USDJPY. Track these for broader signals.
U.S. Treasury Yields Factor
Yields boost USDJPY correlation too. Rising U.S. 10-year yields—up 1% in 2023—pushed USDJPY 3% higher. Higher yields attract dollar investment, weakening the yen. In 2024, yields hit 4.5%, and USDJPY soared to 155.
Interest Rates and Carry Trades
Interest rate gaps fuel USDJPY correlation. U.S. rates at 5% versus Japan's 0.1% in 2023 drove carry trades—borrowing yen to buy dollars. This lifted USDJPY 6%, per Reuters. Rate shifts are a must-watch.
Risk Sentiment Impact
Risk sentiment sways USDJPY correlation. Risk-on boosts stocks and USDJPY—up 4% during a 2023 rally. Risk-off sees yen gains—5% in a week after a 2024 crash. Equities and USDJPY tanked together, showing the link.
Trading the USDJPY Correlation

Use USDJPY correlation to trade smarter. When S&P 500 climbs, go long USDJPY. Nikkei dips? Short it. In 2023, traders pairing equity signals with USDJPY netted 15% more, per TradingView. Timing is everything.
Actionable Tips for Traders
Leverage USDJPY correlation with these:
Monitor S&P 500 and Nikkei daily.
Trade during U.S. hours (13:00-21:00 GMT).
Set stops 20 pips from entry.
Check yields at Treasury.gov.
Test on demos first.
Real Example: 2023 Rally
S&P 500 jumps 5%, Nikkei 3%. USDJPY rises from 145 to 148—300 pips. You buy at 145.50, stop at 145, target 147. Profit: $1,000. USDJPY correlation with stocks paid off.
Avoiding Pitfalls
Mistakes hurt. Ignoring stock trends misses cues—a 2023 Nikkei drop sank USDJPY 4% unspotted. No stops? A yen surge cost $800. Overtrading fees hit $50 daily. Watch USDJPY correlation closely.
Gold and Safe-Haven Twists
USDJPY correlation with gold is shaky. Both are safe havens, but yen wins in crises—up 6% versus gold's 2% in 2024 sell-offs. Stocks fall, yen rises, and USDJPY drops, muddying the link.
Final Thoughts
In conclusion, USDJPY correlation with stocks offers 20-pip daily edges, per 2023 polls. But 60% of retail traders lose without prep, says FCA. Master this, and profits grow.
Unlocking USDJPY correlation with U.S. and Japanese stocks is a game-changer. S&P 500, Nikkei, yields—all tie in. Use them to trade USDJPY smarter. Start small, watch markets, and win with USDJPY correlation.
Disclaimer: This material is for general information purposes only and is not intended as (and should not be considered to be) financial, investment or other advice on which reliance should be placed. No opinion given in the material constitutes a recommendation by EBC or the author that any particular investment, security, transaction or investment strategy is suitable for any specific person.


