While day traders chase momentum and scalpers thrive on volatility, positional trading offers a middle ground — a method for traders who prefer fewer, higher-conviction trades held over days, weeks, or even months. It's not about reacting to every tick, but about recognising when the market sets up for something bigger — and having the patience to ride it out.
Position traders look for clear trends, strong breakouts, or well-timed pullbacks that signal sustained movement. The approach demands precision in entry, discipline in management, and a clear system to stay on the right side of the market without getting shaken out by short-term noise. For traders who value structure and swing-sized payoffs without constant screen time, positional trading can offer a highly effective edge.
Trend-Following: Ride the Momentum
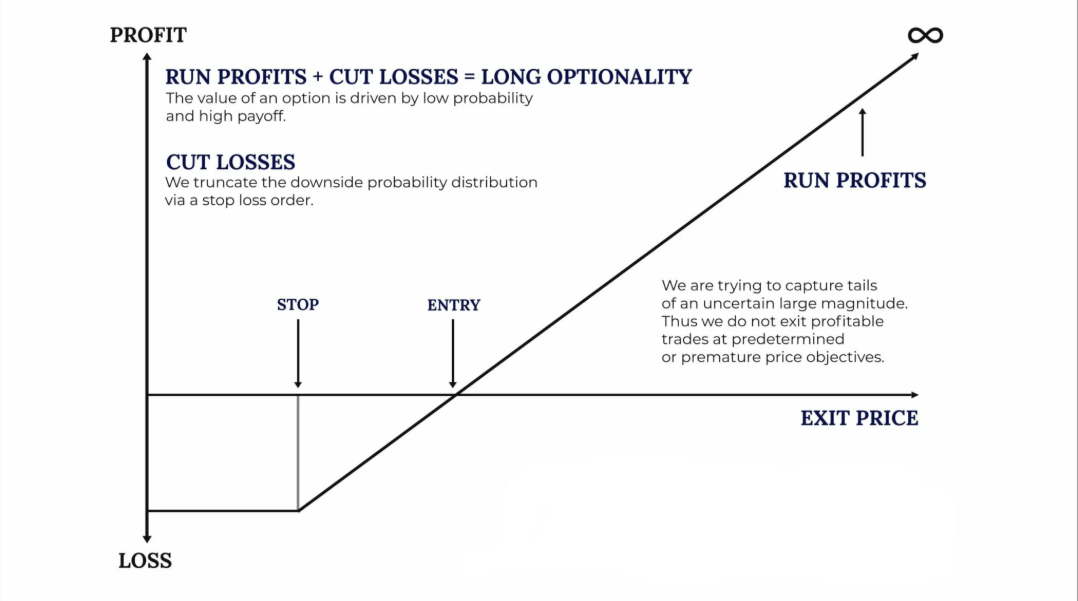
Trend-following is one of the most popular and time-tested approaches in positional trading. The principle is simple: identify a market trend — whether bullish or bearish — and position yourself in the direction of that trend.
How It Works:
Traders typically use long-term moving averages (such as the 50-day and 200-day SMA or EMA) to determine the direction of the trend.
When the price consistently trades above the moving average, it suggests a bullish trend; below, a bearish one.
The goal is to enter the trade once a trend has established itself and exit only when there are clear signs of reversal.
Why It's Effective:
Allows traders to stay in profitable trades longer.
Reduces the noise from short-term volatility.
Works well across various asset classes: stocks, currencies, commodities, and indices.
However, trend-following does require discipline, as false breakouts and corrections can shake out even the most seasoned traders. A clear set of rules and a solid risk management plan are essential.
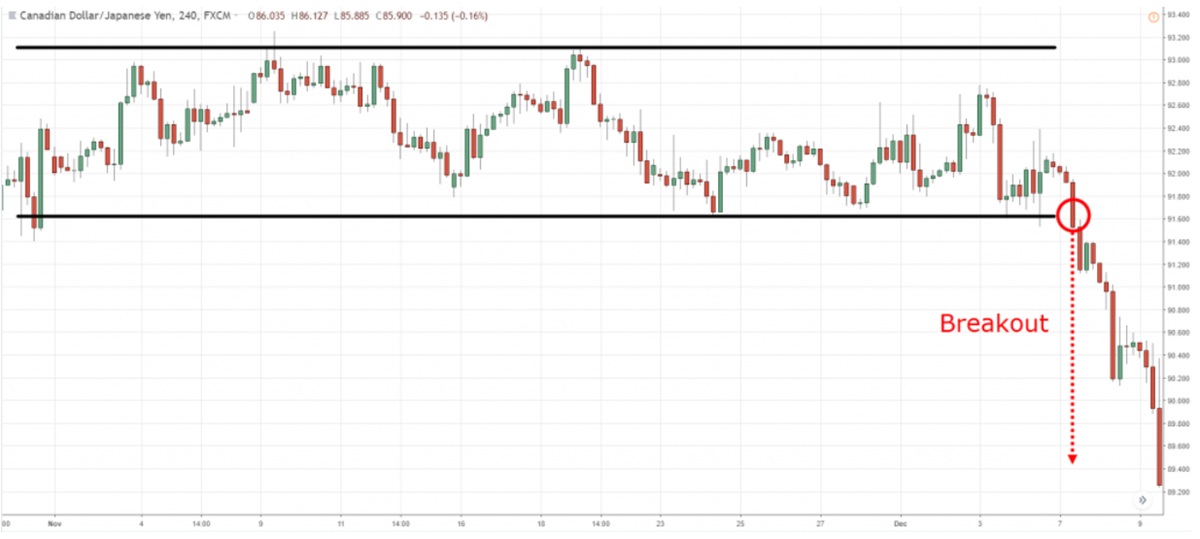
Breakout trading involves entering a position when the price breaks through a well-defined resistance or support level, often accompanied by a spike in volume. This is a sign that new market participants are entering the fray, pushing the price into a new phase.
How It Works:
Traders monitor price consolidation zones or patterns such as triangles, flags, or rectangles.
A breakout above resistance suggests bullish sentiment; a breakdown below support implies bearishness.
Volume plays a key role in confirming whether a breakout is genuine or false.
Why It's Effective:
It provides early entry into potential major price movements.
Offers strong risk-reward ratios if stop-losses are set just below the breakout level.
Works well in volatile markets where large moves often follow consolidation.
Nevertheless, false breakouts (also known as "bull traps" or "bear traps") can occur, making confirmation tools like RSI, MACD, or volume indicators useful for added conviction.
Pullback (Retracement) Trading: Buy the Dip, Sell the Rally
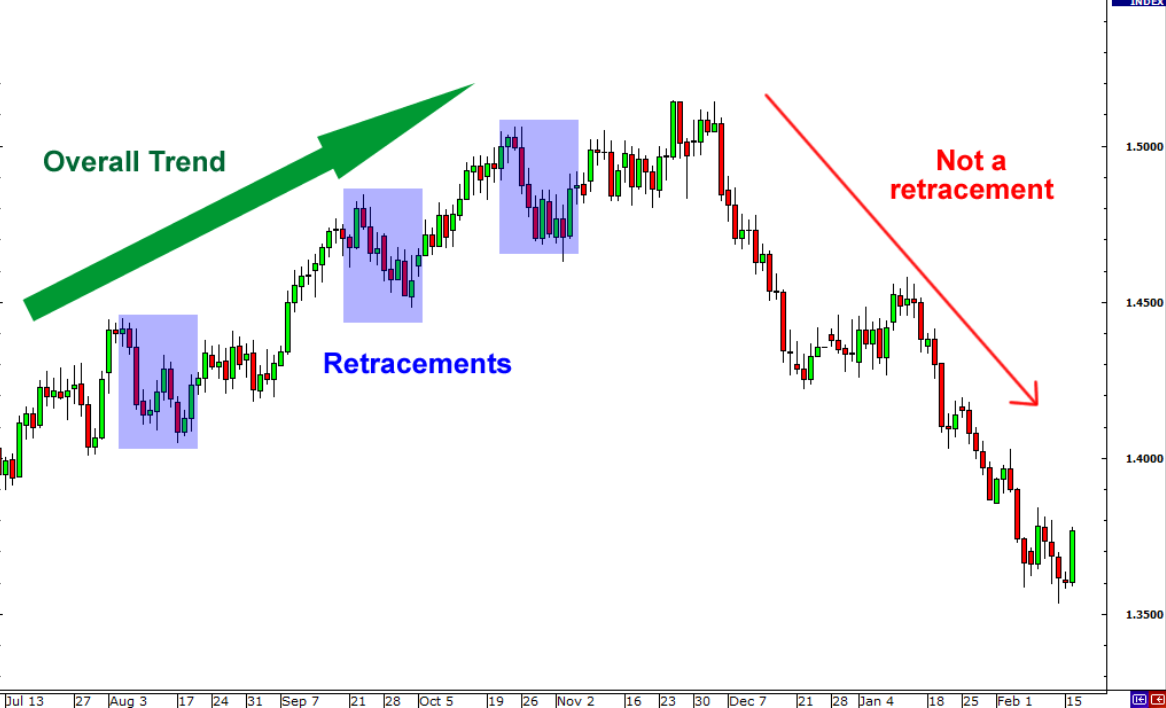
Rather than chasing price at breakout points, pullback traders wait for the market to "breathe" — that is, for a temporary retracement against the prevailing trend — before entering a trade at a more favourable price.
How It Works:
Traders identify a strong trend, then wait for a retracement (often to a support zone or moving average).
Fibonacci retracement levels (such as 38.2%, 50%, and 61.8%) are often used to find key entry points.
Entry signals may be confirmed by candlestick patterns, momentum indicators, or price action cues.
Why It's Effective:
Provides a safer entry into existing trends at a discounted price.
Helps avoid entering overly extended markets at their peak.
Combines well with risk management strategies to reduce drawdowns.
Patience is crucial here — entering too early during a retracement could expose traders to further downside before the trend resumes.
Multiple Timeframe Analysis: Aligning the Bigger Picture
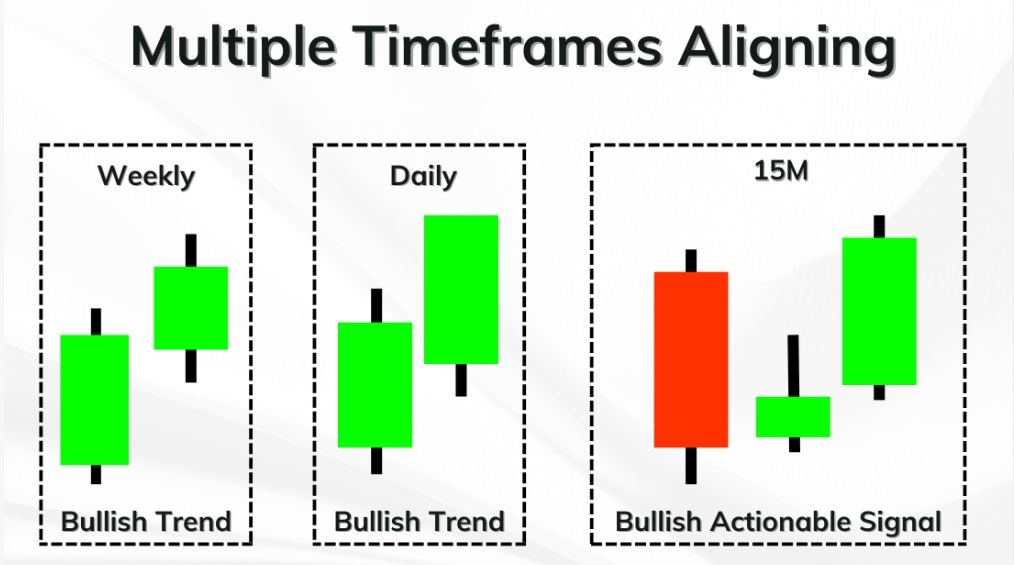
Positional traders often rely on multiple timeframe analysis to ensure their trade aligns with broader market dynamics. This method involves analysing the same asset across different chart periods — for instance, the daily, weekly, and monthly charts.
How It Works:
The higher timeframe (weekly or monthly) defines the primary trend.
The mid-level timeframe (daily) is used for confirmation.
The lower timeframe (4-hour or intraday) can fine-tune entry and exit points.
Why It's Effective:
Ensures trades are placed in harmony with the dominant market direction.
Filters out noise from lower timeframes that may contradict long-term trends.
Enhances confidence and accuracy when entering a position.
This layered view of the market helps traders avoid jumping into short-lived reversals that go against the overall trend.
Fundamental + Technical Hybrid: The Best of Both Worlds
While positional trading is often associated with technical Chart Patterns, many seasoned traders prefer to blend technical analysis with macroeconomic or fundamental insights. This hybrid approach provides a deeper understanding of the asset's intrinsic value and potential catalysts for movement.
How It Works:
Use fundamental analysis to identify strong companies or sectors (e.g. solid earnings, low debt, strong guidance).
Use technical analysis to time entries and exits within those fundamentally strong setups.
Monitor economic indicators, central bank policies, earnings reports, and sector-specific news.
Why It's Effective:
Offers a well-rounded perspective that guards against technical misreads.
Positions the trader to benefit from long-term growth trends and market cycles.
Especially powerful in equity markets, commodities, and macro trading environments.
For example, a fundamentally undervalued tech stock forming a bullish breakout pattern could offer the perfect scenario for a long-term position.
Conclusion: Is Positional Trading Right for You?
Positional trading isn't about chasing quick profits — it's about identifying major trends and patiently riding them out. Whether you favour trend-following, breakout setups, or hybrid models, the common thread is discipline, planning, and emotional control.
For investors and traders who are willing to wait for high-quality setups and avoid the daily stress of intraday moves, positional trading offers a rewarding path to consistent growth. With proper tools, analysis, and risk management, you can turn slow and steady into a powerful financial strategy.
Disclaimer: This material is for general information purposes only and is not intended as (and should not be considered to be) financial, investment or other advice on which reliance should be placed. No opinion given in the material constitutes a recommendation by EBC or the author that any particular investment, security, transaction or investment strategy is suitable for any specific person.


