Published on: 2024-03-07
Updated on: 2024-05-28
There is a saying in the investment world that it is better to choose stocks than time. The meaning of this sentence is to rely on the selection of a stock to make money; it is better to choose a good time to operate so that the chances of making money are greater. If a good stock is bought and sold at the wrong time, it can lead to investment losses. And if the timing of the purchase and sale of the right words is right, it is possible to get a good profit. To grasp the timing of the purchase and sale, the determination of support and resistance levels is very important. Here's a good look at resistance levels and their trading strategies.
 What do Resistance Levels mean?
Also known as a pressure level, it is a price level at which the price of a stock or currency tends to be suppressed by sellers' forces, making it difficult to break out to the upside. This is because at that price level, investors may be inclined to sell the stock or currency for a profit, or because that price is seen as too high or unreasonable.
It also means that when the stock price rises to the neighborhood of a certain price level, the stock stops rising. It's as if some force from above is holding the stock price down or even appearing to pull back. It literally presses downward and stops the rise.
This type of pressure is generally defined as selling pressure that prevents the price from continuing to rise for a period of time, that is, when the stock price reaches a certain position if the selling pressure becomes so great that it prevents the price from rising any further, as if there were a ceiling. Such a price level that can prevent or temporarily stop the price from rising is called a pressure level.
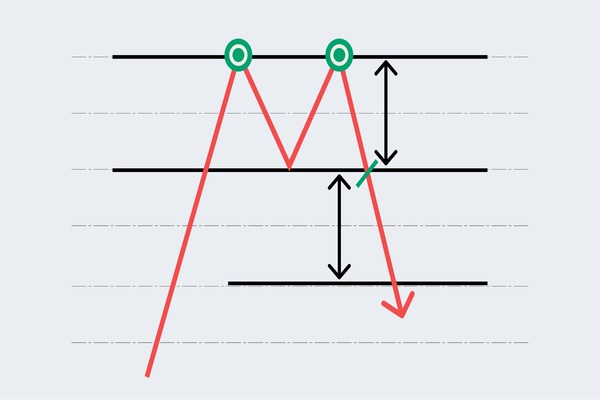
For example, if the stock rises from $80 to $100 and then backs down, and then rallies again to $100 and back down, then there is a lot of selling pressure around $100. preventing the price from continuing to rise for a period of time, so this $100 can be regarded as a pressure zone.
Generally, on a chart, resistance or pressure is a line. To connect the highs of at least two waves and extend a line to the right of the K chart, there is a resistance line. It is usually a horizontal or downward-sloping line, and price rises are impeded and fall when they touch the pressure line.
The opposite is the support level, which on the chart is usually a horizontal or upward-sloping line. When the price falls to touch the support line, it will often be supported and rise. It is drawn by connecting the lows of at least two waves on the k-chart and extending a line to the right of the k-chart.
It is important to note that resistance and support are interchangeable. That is, the first time a stock successfully breaks through a pressure zone, the original pressure zone becomes a support zone down the road. On the other hand, if the stock price breaks below the support zone, the original support zone will become a pressure zone down the road.
For example, if the stock price originally oscillated between $80 and $100 and some investors bought the stock in the range of the oscillation, the range of the oscillation is the cost area of these investors. As a result, the stock price, after a round of consolidation, eventually fell below the support zone near $80; that is to say, the investors who previously bought at $80-100 fell into a loss.
From a Trading Psychology perspective, no one likes to lose money. While some people are able to overcome the psychological barrier and quickly admit their losses, there are still many who choose to remain trapped by continuing to hold on. They expect to sell when the stock price rallies back to near their cost price. So when the stock price has a chance to bounce back to near the previous support area, that is, when the stock price bounces back to near $80. the stock price is actually close to returning to the cost price of those who are trapped.
They will want to sell their shares to get out of the trap, so there is a lot of selling pressure that prevents the stock from rising further. So although the location of $ 80 is the original range oscillator support area, the support area was broken, and later, when the stock price rebounded, we will have to unwind the selling pressure of the disk so that the original support area of $ 80 has become a new pressure area.
Also, something to keep in mind. Resistance observed in longer time frames is usually more important than in shorter time frames, and once a stock or currency price reaches a resistance level, investors may expect prices to fall or a sustained trading range to occur.
Price charts allow traders and investors to visually identify areas of resistance and provide clues as to the importance of these price levels. More specifically, they look at the number of touches, and testing resistance areas multiple times increases their importance as it attracts more buyers and sellers to make trading decisions.
In short, resistance levels can limit the power of prices to continue to rise as there is more seller power at that price level, making it difficult for prices to break through. If the price manages to break through the resistance, it may trigger a further rise, which may stimulate more buyer interest.
| Type | Description. |
| Historical Highs | Rise to previous all-time highs blocked |
| Moving Average | Rise blocked near moving averages |
| Fibonacci Retracement | Rise to Fibonacci retracement level blocked |
| Volume Peaks | Volume peaked on the rise. |
| Trendline | Rise blocked by trendline |
It is formed by seller power in the market. When stock or currency prices rise, sellers may emerge at a certain price level to take profits or choose to sell as they believe the current price is too high. This seller pressure creates a resistance level in the market that prevents prices from continuing to rise.
As prices approach or reach all-time highs or key price levels, investors may feel fear or anxiety that the current price is too high and a price pullback is likely. As a result, they may choose to sell at this price level, creating resistance.
Alternatively, there may be a large number of sell orders at a certain price level, i.e., supply exceeds demand. This may be due to the fact that in past trades, investors have purchased a large number of shares or currencies at this price level and have chosen to sell when the price has risen back up to this level, thus creating resistance.
There is also resistance that develops when the price rises to a certain level and investors holding positions may choose to take profits, leading to an increase in sell orders. This phenomenon is known as profit retraction, where an investor takes a profit from a previous purchase price and sells their asset at a higher price. This behavior usually leads to a certain degree of impediment to price increases, creating resistance.
This can be more easily understood through a story, such as the one about a businessman who buys 50 shiny gold bars from a foreign country at a cost of 1.000 dollars each. Then he brought them back to his hometown and set up a stall to sell them at a starting price of 1.100 dollars. At first, many people came to buy the last five gold bars left when the merchant increased the price. Each of them was priced at 1.200 dollars, and the result was still swept away. On that day, the merchant successfully sold out the gold bars to earn a large sum of money.
So the next day, hurry to the field again with the same cost of 1000 yuan to buy 100 gold bars, and then bring them back to his hometown to sell. This time each directly marked 1500 dollars; the first day sold 5 gold bars, but the next day business suddenly stagnated; no one came to buy gold bars.
The reason was that some of the customers who had bought the gold bars before actually set up stalls to sell them as well. And in order to get the business, they sold a gold bar for only 1.300 dollars, stealing away the customers. The merchant then decided to lower the price, selling a gold bar for only 1200 dollars, which really attracted some guests back. But other stalls also quickly followed the price cut, selling at 1150 dollars.
Directly, the price dropped to 1100 dollars, and the businessman's business suddenly boomed. Because this was the selling price the first time the stall opened for sale, many of the people who didn't buy at this lowest price before felt regretful, so when it was re-sold at $1100. many buyers began to frantically sweep up the goods.
At the same time, other sellers are no longer choosing to reduce the price because they had 1100 dollars with you to buy. There is no reason to sell at 1100 or lower prices, so this 1.100 dollar market price no longer continues to drop. At this point, it can be said that the price of $1100 forms a support level because this price attracts strong market demand. If more people think that $1100 is a reasonable price to buy or if more people keep buying here because they are afraid of missing out, the more effective this support level will be.
The story continues when the trader realizes that customers are buying in droves at the low price of $1100. The next day, he slowly started to raise the price again, selling at $1200. then a week later at $1300. Then 1500. After a month of selling only 5 bullion, the trader again marked the price at 1600 dollars, but bullion at this price is always unsold.
It's worth mentioning that some sellers had bought a lot of gold bars from the merchant before, originally expecting the price of gold to continue to rise greatly and then take them out for resale, but after nearly a month of falling prices, they realized that 1.500 dollars was the highest price these days. Therefore, a month after the rare encounter, 1.500 yuan price quotations are rushed to the home of the gold bars out to sell, and even more efforts to set up stalls to sell day and night sales hope not to miss this wave of market.
Invisible, many sellers hearts began to default. If 1500 is the ceiling of the price of gold bullion, then it can be said that this price level formed a resistance level. Because this price attracts a huge market supply, the more people think that 1500 is the top price of gold bullion, or the more people choose to sell gold bullion at this price for fear of missing out, the more effective this resistance will be.
Resistance levels can also be formed because technical analysts often use Chart Patterns and technical indicators to determine price resistance. Some common technical factors include all-time highs, moving averages, and Fibonacci retracement levels. As price approaches or reaches these technical levels, traders may expect price gains to be impeded; thus, resistance is formed.
In a nutshell, resistance is formed by seller power in the market and usually occurs when the price of a stock or currency rises because, at this price level, sellers are willing to sell their assets, thus inhibiting further price increases.

It is used in technical analysis to describe the point of obstruction encountered when the price rises. This price level is usually the point at which the price has risen to a certain point and is struggling to continue to rise due to increased seller power or selling pressure from investors. It is generally estimated by analyzing historical price movements and other technical indicators and cannot be numerically calculated. As shown in the chart above, Europe and the United States against the U.S. dollar on three occasions encountered resistance at the green line attachment, so there is a pressure level here.
However, through wave theory, you can extend such a formula to get an approximate value so that we can find the resistance point faster. The formula is: (b × c) ÷ a.
The formula is divided into two steps. The first is to find the lowest point in the rising wave of a stock, marking it as point a. The second is to find the high point after the rally. Then find the high point after the rally and mark it as point B. Then the first retracement point of the stock price is set to c. Then, by plugging these numbers into the above formula, you will be able to get the pressure level.
For example, a stock's low during a wave up is 31.89. The rally high is 35.58. The retracement point is 34 dollars. Applying the formula just described, the rally point b is multiplied by the retracement c and then divided by the low point a. That is 35.58 multiplied by 34. and then divided by 31.89. The result is 37.93. This is a short period of time due to the pressure level.
This is a short-term pressure level. When this pressure level is reached, investors will know what price level to pay attention to. In the upper part of the price of this resistance, we know what position we can step into to trade. However, it is important to note that, whether resistance or support, it is not a line or a single price, but an area.
In actual trading, investors don't think of resistance as an exact value but rather as a price area. When the price approaches resistance, the investor adopts a trading strategy, such as reducing the position or setting a stop-loss order, in order to cope with the situation where the price rise is blocked.
Because resistance is a good time to intervene, it is often used by investors as the centerpiece of their trading strategy decisions. Of course, support levels, which are interchangeable with them, are also equally important for investors to trade. Generally, investors will choose them as buy and sell points; for example, the most common is to buy at the support level and then sell at the resistance level.
The strategy of buying near support and selling near resistance generally works in a range-bound market without news interfering with the market. For traders who are able to stop their losses in time, this entry strategy offers the opportunity for high win rates and consistent profits.
Buying above resistance and selling below support, on the other hand, is a trend-following trading strategy. While the win rate for this strategy may be less than 50%, the profits may far outweigh the losses. This strategy is suitable for high-volatility markets where the probability of a market trend is higher. Investors can also use this strategy after news events, which are more likely to be profitable.
professional traders, on the other hand, use a strategy that involves buying before false support breaks and selling before false resistance breaks. When the market breaks through support, many traders will enter the market with a sell. However, if the market rallies above support, traders who sold will be faced with unrealized losses and will have to buy back in to minimize their losses. A move back above the system signals range traders to take a long position and pushes prices higher.
It is also possible to sell ahead of support and buy ahead of resistance. It is important to realize that strongly trending markets are likely to continue moving in one direction until support or resistance is reached. Professional traders can look for stop-loss orders from other traders by selling before support levels and buying before resistance levels.
This strategy offers high-risk-reward trading opportunities. Set a target below the support level when selling. If the trend is strong, the market may break through support to extend profits. Conversely, if the market stops falling after hitting support, it can be exited with a smaller profit.
Resistance analysis is one of the basic operations of an introductory investment strategy and can be used to manage profit, set stop losses, and determine entry and exit points. However, there are many other factors that influence price movements, and support and pressure levels are often breached. So when judging the strength of its role, it needs to be analyzed specifically in relation to the overall market situation.
| Strategies | Description | Advantages |
| Sell or reduce positions. | Sell or reduce position near resistance | Make a profit or reduce risk. |
| Set Stop Loss Orders | Place a stop-loss order at resistance. | Limit potential losses |
| Watch or Lighten Up | Watch or reduce near resistance. | For uncertain investors |
| Rebound Trading | Buy-on-price retracement | Pursue price rise opportunity |
| Short Short Strategy | Sell short futures near resistance. | Earn the benefits of falling prices. |
Disclaimer: This material is for general information purposes only and is not intended as (and should not be considered to be) financial, investment, or other advice on which reliance should be placed. No opinion given in the material constitutes a recommendation by EBC or the author that any particular investment, security, transaction, or investment strategy is suitable for any specific person.